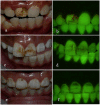
Dental fluorosis in populations from Chiang Mai, Thailand with different fluoride exposures - paper 2: the ability of fluorescence imaging to detect differences in fluorosis prevalence and severity for different fluoride intakes from water
- PMID: 22908997
- PMCID: PMC3478182
- DOI: 10.1186/1472-6831-12-33
Dental fluorosis in populations from Chiang Mai, Thailand with different fluoride exposures - paper 2: the ability of fluorescence imaging to detect differences in fluorosis prevalence and severity for different fluoride intakes from water
Abstract
Background: To assess the ability of fluorescence imaging to detect a dose response relationship between fluorosis severity and different levels of fluoride in water supplies compared to remote photographic scoring in selected populations participating in an observational, epidemiological survey in Chiang Mai, Thailand.
Methods: Subjects were male and female lifetime residents aged 8-13 years. For each child the fluoride content of cooking water samples (CWS) was assessed to create categorical intervals of water fluoride concentration. Fluorescence images were taken of the maxillary central incisors and analyzed for dental fluorosis using two different software techniques. Output metrics for the fluorescence imaging techniques were compared to TF scores from blinded photographic scores obtained from the survey.
Results: Data from 553 subjects were available. Both software analysis techniques demonstrated significant correlations with the photographic scores. The metrics for area effected by fluorosis and the overall fluorescence loss had the strongest association with the photographic TF score (Spearman's rho 0.664 and 0.652 respectively). Both software techniques performed well for comparison of repeat fluorescence images with ICC values of 0.95 and 0.85 respectively.
Conclusions: This study supports the potential use of fluorescence imaging for the objective quantification of dental fluorosis. Fluorescence imaging was able to discriminate between populations with different fluoride exposures on a comparable level to remote photographic scoring with acceptable levels of repeatability.
Figures


References
-
- Dean HT. In: Fluorine and dental health. Mouton FR, editor. American Association for the Advancement of Science, Washington (DC); 1942. The investigation of physiological effects by the epidemiological method; pp. 23–31.
-
- Horowitz HS, Driscoll WS, Meyers RJ, Heifetz SB, Kingman A. A new method for assessing the prevalence of dental fluorosis–the Tooth Surface Index of Fluorosis. J Am Dent Assoc. 1984;109(1):37–41. - PubMed
-
- Angmar-Mansson B, de Josselin de Jong E, Sundstrom F, ten Bosch JJ. Strategies for improving the assessment of dental fluorosis: focus on optical techniques. Adv Dent Res. 1994;8(1):75–79. - PubMed
Publication types
MeSH terms
Substances
Grants and funding
LinkOut - more resources
Full Text Sources
Miscellaneous

