

Review
doi: 10.1093/ehjci/jes174.
Epub 2012 Aug 21.
New echocardiographic techniques for evaluation of left atrial mechanics
Affiliations
- PMID: 22909795
- PMCID: PMC3598416
- DOI: 10.1093/ehjci/jes174
Item in Clipboard
Review
New echocardiographic techniques for evaluation of left atrial mechanics
Eur Heart J Cardiovasc Imaging.
2012 Dec.
Abstract
Until recently the left atrium had been subordinate to the left ventricle, but cardiologists now recognize that left atrial (LA) function is indispensable to normal circulatory performance. Transthoracic two-dimensional (2D) and Doppler echocardiography can elucidate parameters of LA function non-invasively. Yet, with the advent of 2D speckle-tracking echocardiography, we are able to detect early LA dysfunction even before structural changes occur. This is pivotal in some common disease states, such as atrial fibrillation, hypertension, and heart failure, in which LA deformation parameters can influence clinical management. However, a unique standardized technique to investigate LA deformation needs to be validated.
Figures
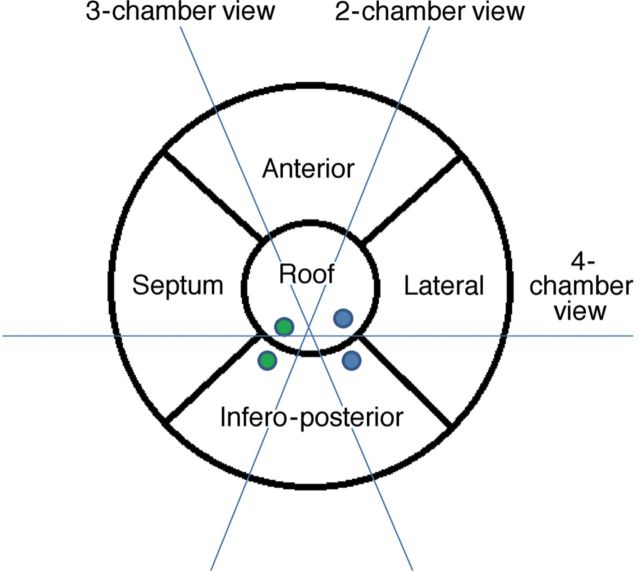
Proposal of a five-segment model for left atrial segmentation by transthoracic two-dimensional echocardiography: The apical four-chamber view cuts the heart obliquely from the apex of the left ventricle. Conventionally, the interatrial septum is situated medially and the lateral wall on the opposite side, inferiorly the mitral annulus and superiorly the roof. The anterior and infero-posterior walls can be visualized in the apical two-chamber view. Only the infero-posterior wall can be observed, facing the aorta, in a three-chamber view. The green and blue solid dots represent right and left pulmonary veins (upper and lower), respectively.
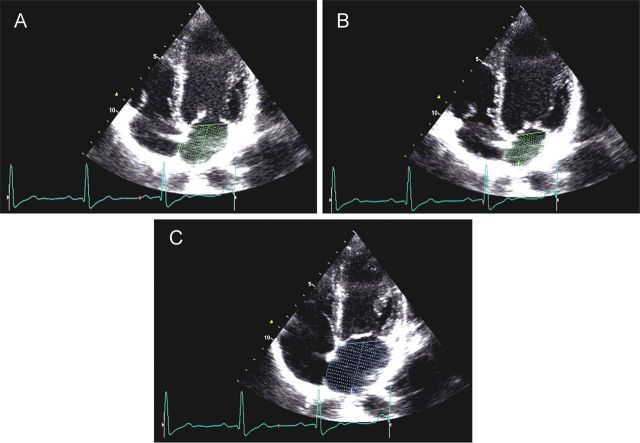
Preatrial contraction volume (VpreA), measured at the onset of the P-wave on an electrocardiogram (A); minimal left atrial (LA) volume (Vmin), measured at the closure of the mitral valve in end diastole (B); and maximal LA volume (Vmax), measured just before the opening of the mitral valve in end-systole (C).
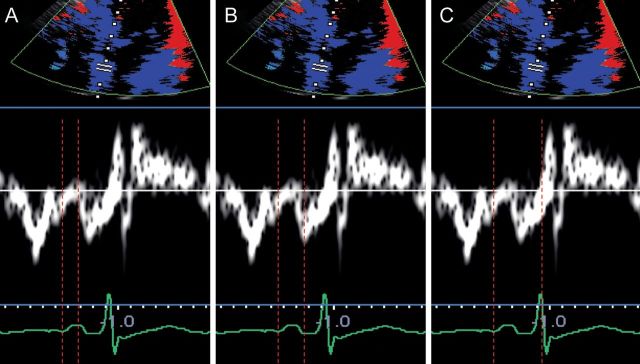
Left atrial electromechanical intervals measured through tissue Doppler imaging: p-A start interval, measured from the onset of the P-wave to the onset of A′ (A); p-Apeak interval, measured from the onset of the P-wave to the peak of A′ (B); total electromechanical time, measured from the onset of the P-wave to the end of A′ (C).
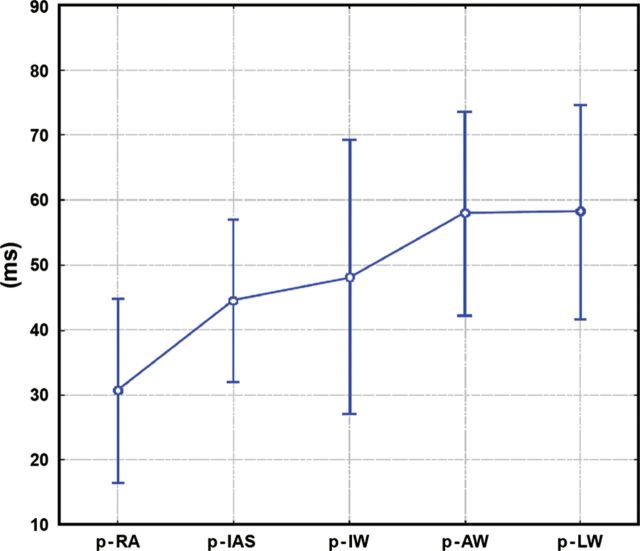
Atrial electromechanical sequence during sinus rhythm in a control group. Graph represents mean values ± standard deviation and 95% confidence interval. Interatrial dyssynchrony is defined as the absolute value of time difference between p-LW and p-RA; Intra-left atrial dyssynchrony is defined as the maximal time difference among p-LW, p-IW, p-AW, and p-IAS; Intra-right atrial dyssynchrony is defined as the absolute value of time difference between p- RA and p-IAS. p-RA, p-IAS, p-IW, p-AW, p-LW: time distance from the atrial pacing spike (p) till the beginning of the A′-wave assessed by pulsed-wave tissue Doppler echocardiography in the middle of the lateral right atrial wall and the middle of the interatrial septum, inferior, anterior, and lateral left atrial walls, respectively. (Reproduced from Ref. with permission from John Wiley and Sons.)
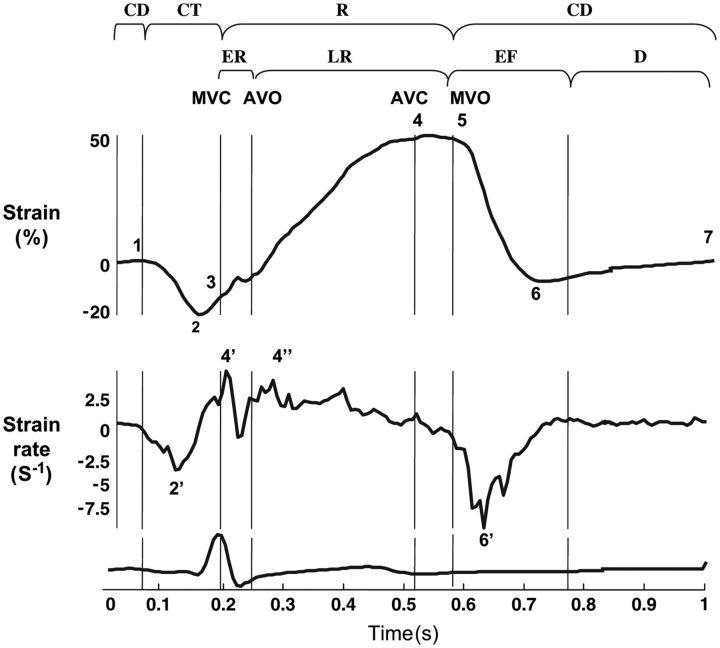
Extracted strain rate (SR) profiles for left atrial wall longitudinal deformation. MCV, mitral valve closure; AVO, aortic valve opening; AVC, aortic valve closure; MVO, mitral valve opening; CT, contractile period (1, onset; 2, peak ε; 2′, peak SR; 3, end); R, reservoir period (3, onset; 4, peak ε; 5, end); ER, early reservoir period (4′, peak SR); LR, late reservoir period (4″, peak SR); CD, conduit period (5, onset; 6, peak ε; 6′, peak SR; 7, end of LA wall deformation during diastasis); EF, early ventricular filling; D, diastasis. (Reproduced from Ref. 7 with permission from Oxford University Press.)
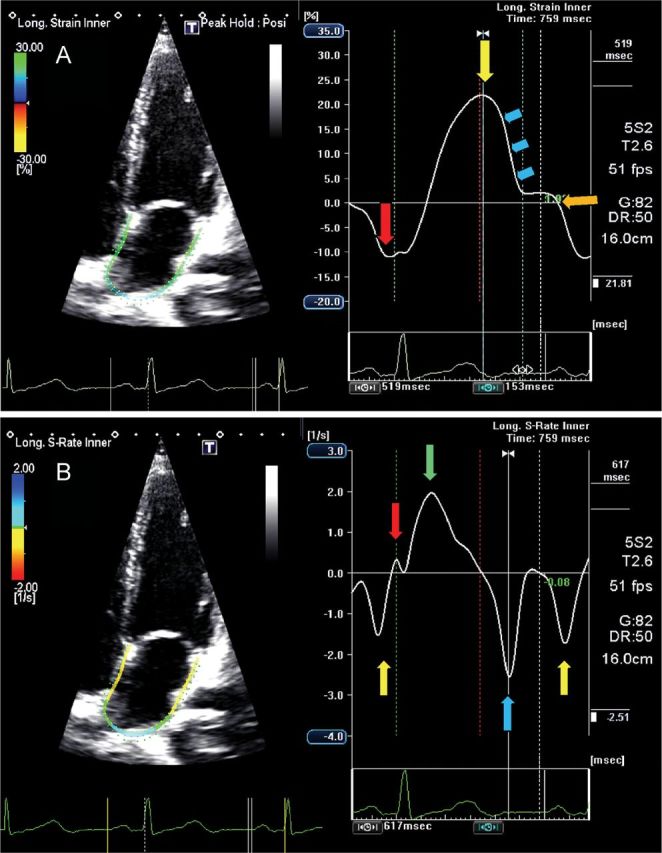
Four-chamber view showing global left atrial (LA) longitudinal strain (A) and strain rate (B) in a normal subject. The trigger is before the P-wave on the electrocardiogram. (A) The negative peak of the contractile phase (red arrow), the positive peak of the reservoir phase (yellow arrows) and the conduit phase, which includes early diastole (blue arrows) and diastases (orange arrow). (B) The peak of the LA contractile phase in late diastole (yellow arrow), the early (red arrow) and late peak (green arrow) of the reservoir phase during ventricular systole, and the conduit phase in early diastole (blue arrow).
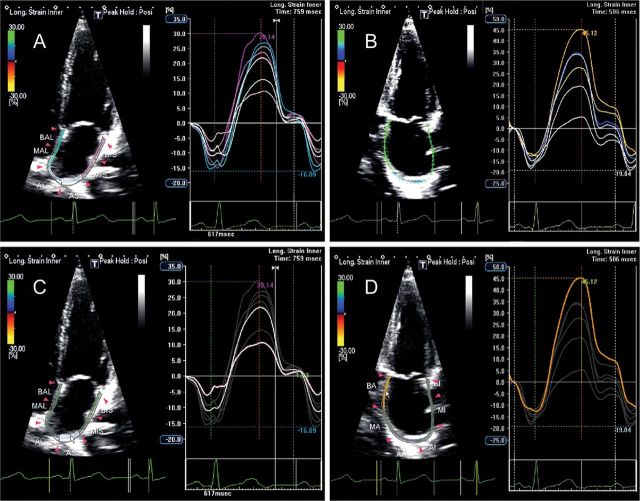
Two-dimensional echocardiography apical four-chamber view (A) and apical two-chamber view (B) showing left atrial longitudinal strain in a normal subject. Longitudinal strain during the reservoir phase in the roof segment (C, pink line) shows lower absolute values when compared with the annular segment of the inferior wall (D, brown line).
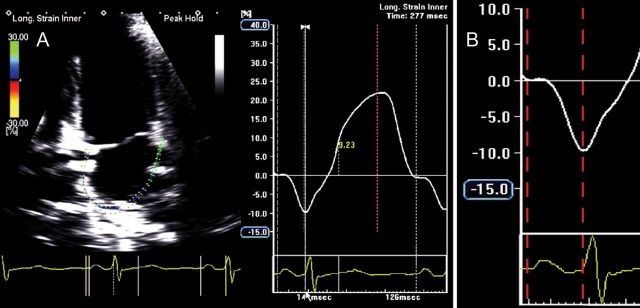
Global left atrial (LA) longitudinal strain (A) and detail of global LA longitudinal strain during the contractile phase (B) showing an atrial electromechanical delay of 126 ms, measured from the onset of the P-wave to the negative peak of the curve, in a normal subject. (Time interval depicted between the two red dotted lines.)
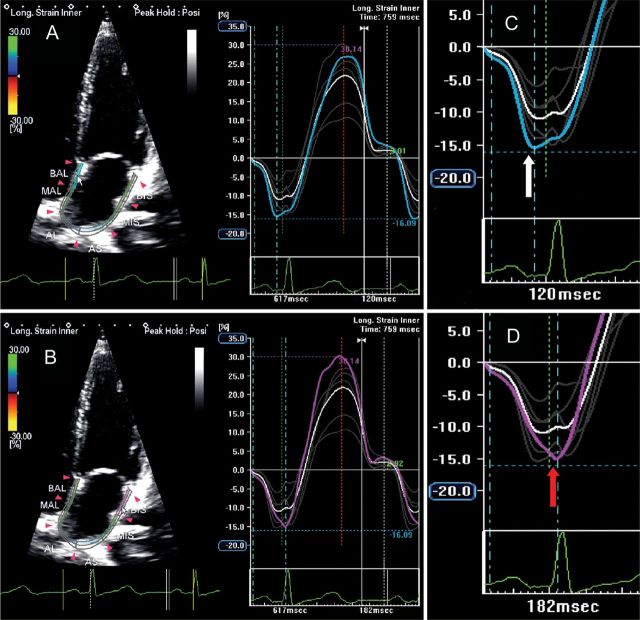
Two-dimensional echocardiography apical four-chamber view showing left atrial longitudinal strain in a normal subject: the blue line (A) and the purple line (B) represent mechanical deformation of the interatrial septum and the lateral wall. As expected, the negative peak of interatrial septum (C, white arrow) occurs before the negative peak of lateral wall (D, red arrow), showing a delay of 60 ms between the two peaks.
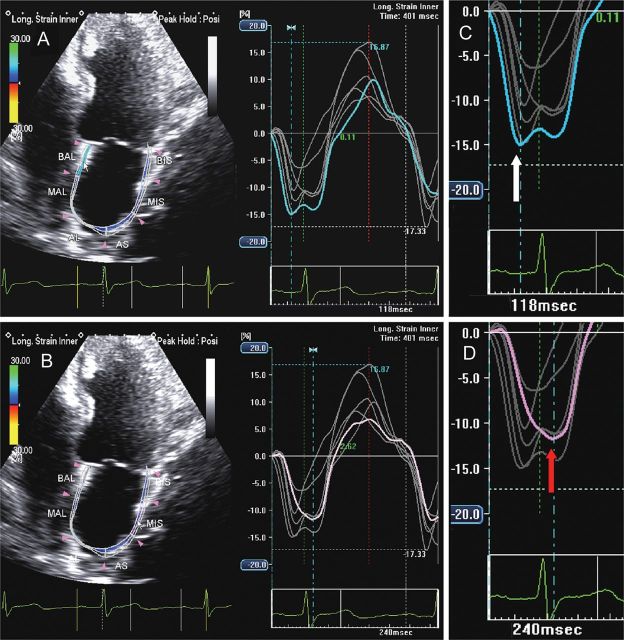
Two-dimensional echocardiography apical four-chamber view showing left atrial longitudinal strain in a patient with heart failure and P-wave prolongation: the blue line (A) and the purple line (B) represent mechanical deformation of the interatrial septum and the lateral wall. The negative peak of the interatrial septum (C, white arrow) occurs before the negative peak of the lateral wall (D, red arrow), but a prolonged intra-atrial electromechanical delay is demonstrated by an interval of 122 ms occurring between the two peaks.
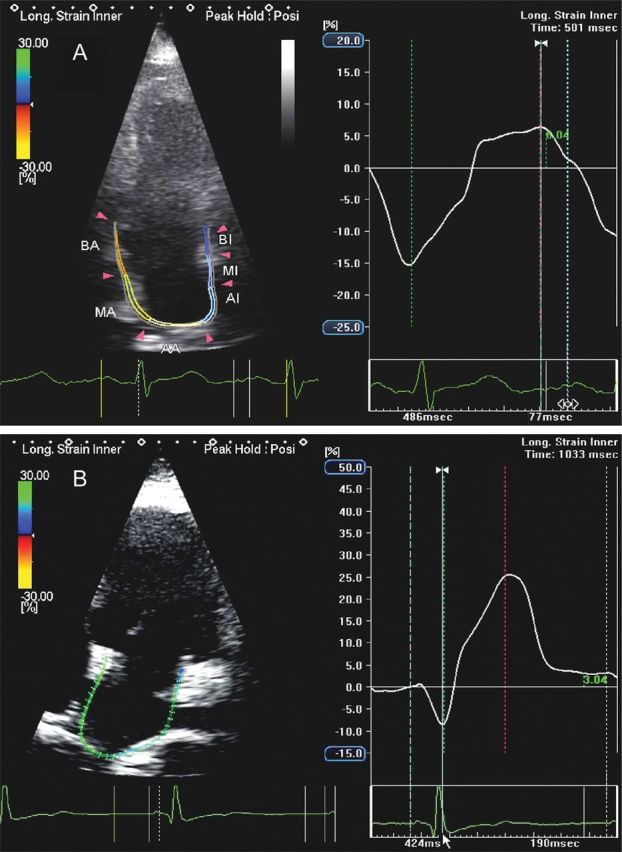
Apical four-chamber view in a patient with heart failure showing a severe reduction in left atrial (LA) reservoir function and a compensatory increase in LA contractile function (A) when compared with a normal subject (B).
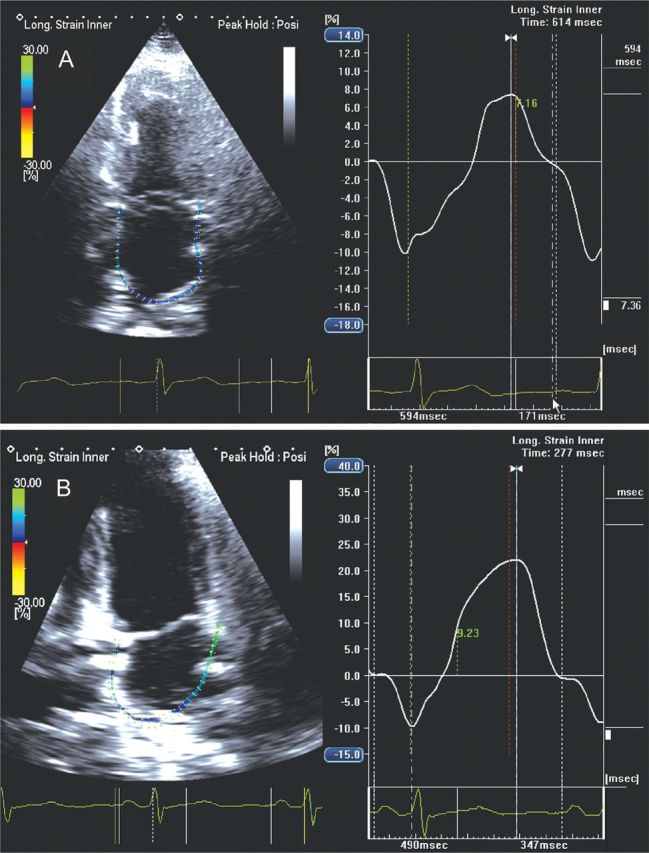
Apical four-chamber view in a hypertensive patient showing global left atrial (LA) longitudinal strain at initial state of the disease with a reduction in LA reservoir function (A) when compared with a normal subject (B) (7.36 vs. 21.99%).
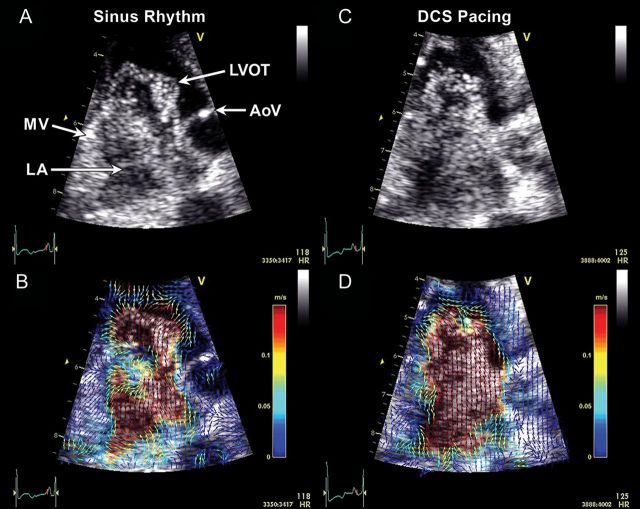
Examples of left atrial (LA) microbubble contrast (A and C) and corresponding echocardiographic particle image velocimetry (PIV) (B and D) obtained in a three-chamber view. In sinus rhythm, a clockwise-rotating vortex within the LA followed by a strong early (i.e. before the P-wave) transmitral filling jet are visible (A, Supplementary data online, Video S1 ), and enhanced with colour-coded vector field depictions through PIV analysis (B, Supplementary data online, Video S2 ). During distal coronary sinus (DCS) pacing, which activates the LA in the opposite direction, the LA vortex appears to rotate in a counterclockwise direction compared with sinus rhythm. A strong early filling jet was not apparent and the majority of the transmitral filling flow appeared following the DCS stimulus (C, Supplementary data online, Video S2 ). PIV graphically depicts the direction and magnitude of velocities across the flow field (D, Supplementary data online, Video S2 ). A clockwise-rotating vortex also can be seen in the left ventricular outflow tract (LVOT) prior to ventricular ejection in both examples. AoV, aortic valve; MV, mitral valve.
Comment in
-
Left atrial reservoir phase: deformation analysis.Eur Heart J Cardiovasc Imaging. 2013 May;14(5):500-1. doi: 10.1093/ehjci/jes316. Epub 2013 Jan 11. Eur Heart J Cardiovasc Imaging. 2013. PMID: 23313917 No abstract available.
-
Left atrial mechanics: new echocardiographic techniques for function evaluation: our reply.Eur Heart J Cardiovasc Imaging. 2013 May;14(5):500. doi: 10.1093/ehjci/jes317. Epub 2013 Jan 11. Eur Heart J Cardiovasc Imaging. 2013. PMID: 23720826 No abstract available.
References
-
- Ho SY, Anderson RH, Sánchez-Quintana D. Atrial structure and fibres: morphologic bases of atrial conduction. Cardiovasc Res. 2002;54:325–36. - PubMed
-
- McAlpine WA. Heart and Coronary Arteries: an Anatomical Atlas for Clinical Diagnosis, Radiological Investigation, and Surgical Treatment. Verlag, Berlin: Springer; 1975. pp. 58–9.
-
- Markides V, Schilling RJ, Ho SY, Chow AW, Davies DW, Peters NS. Characterization of left atrial activation in the intact human heart. Circulation. 2003;107:733–9. - PubMed
-
- Dabrowska-Kugacka A, Lewicka-Nowak E, Ruciński P, Zagozdzon P, Raczak G, Kutarski A. Atrial electromechanical sequence and contraction synchrony during single- and multisite atrial pacing in patients with brady-tachycardia syndrome. Pacing Clin Electrophysiol. 2009;32:591–603. - PubMed
-
- Lang RM, Bierig M, Devereux RB, Flachskampf FA, Foster E, Pellikka PA, et al. Recommendations for chamber quantification: a report from the American Society of Echocardiography's guidelines and standards committee and the chamber quantification writing group, developed in conjunction with the European Association of Echocardiography, a branch of the European Society of Cardiology. J Am Soc Echocardiogr. 2005;18:1440–63. - PubMed
Publication types
MeSH terms
Grants and funding
LinkOut - more resources
Full Text Sources
Medical
