

Distortion products and their influence on representation of pitch-relevant information in the human brainstem for unresolved harmonic complex tones
- PMID: 22910032
- PMCID: PMC3483078
- DOI: 10.1016/j.heares.2012.08.001
Distortion products and their influence on representation of pitch-relevant information in the human brainstem for unresolved harmonic complex tones
Abstract
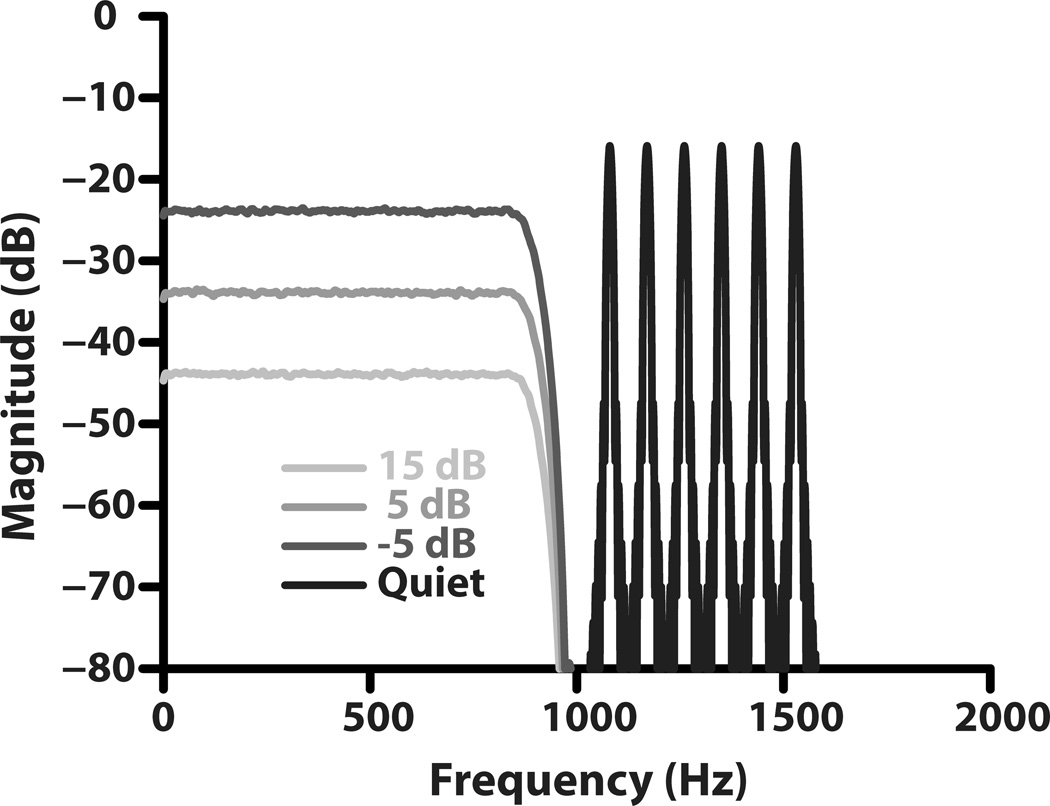
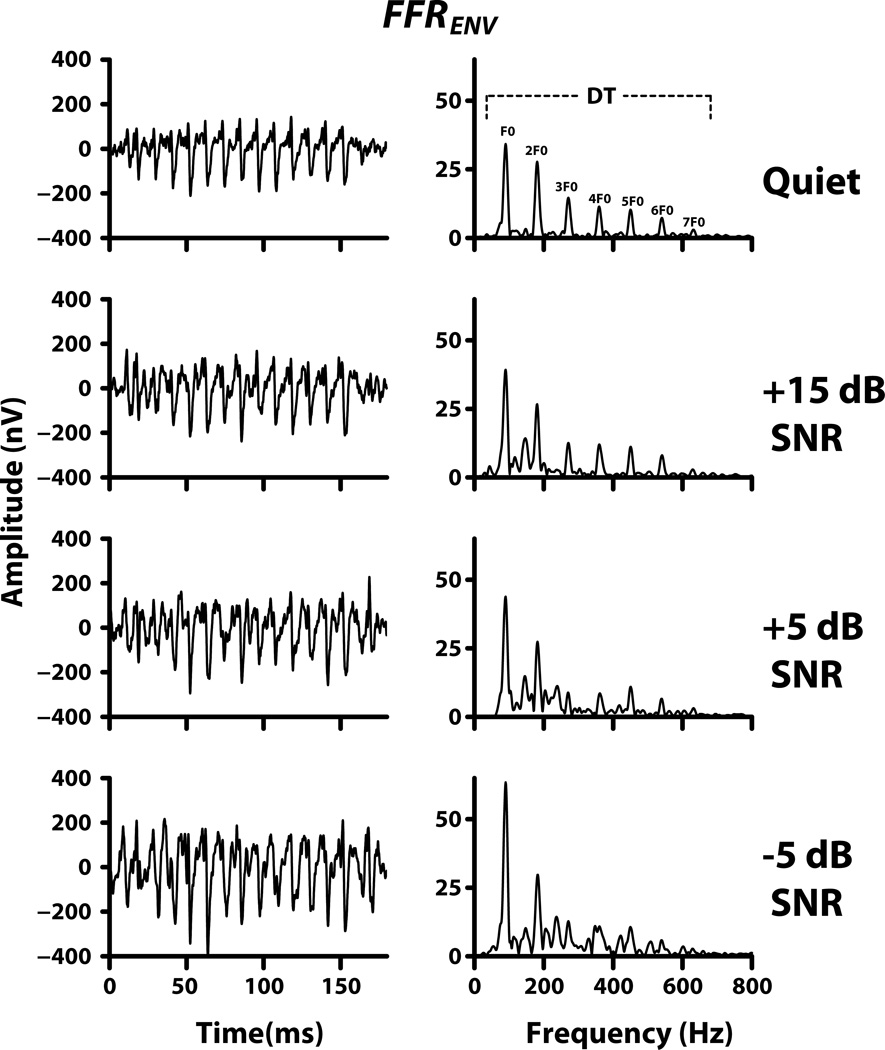
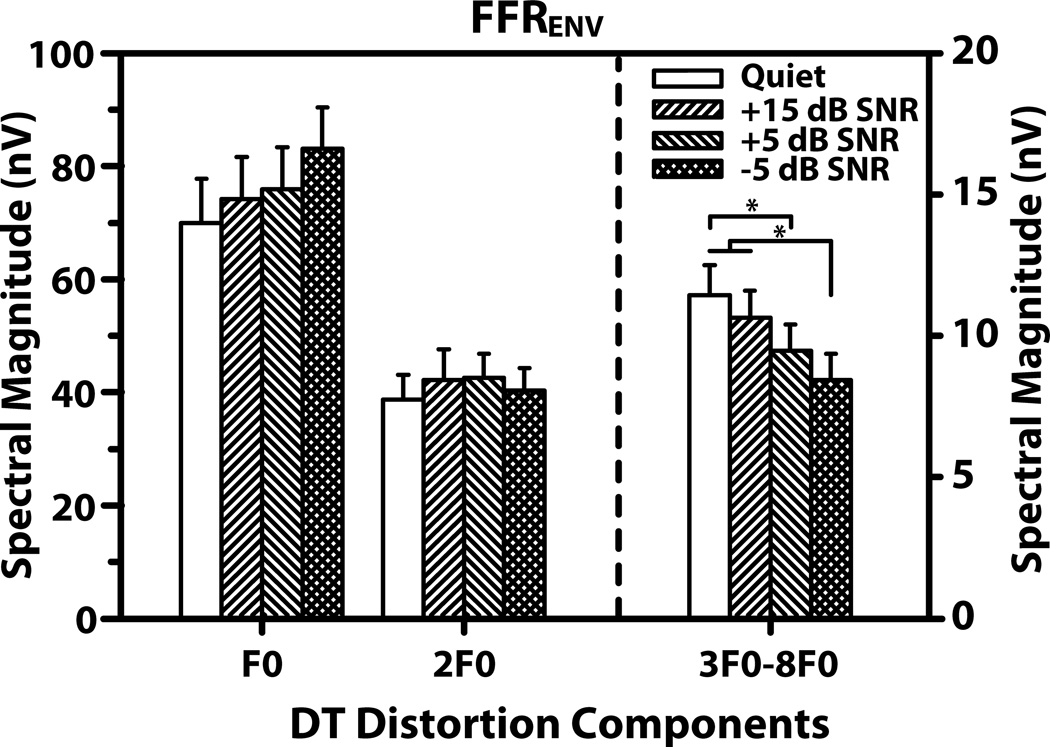
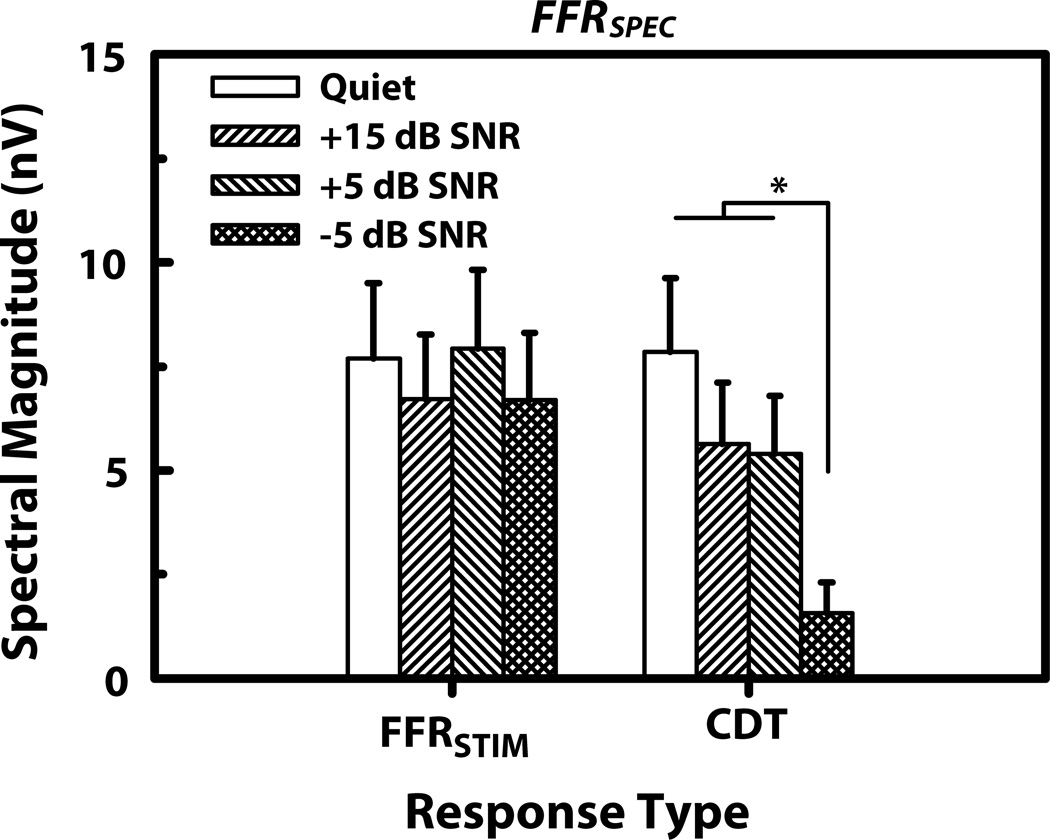
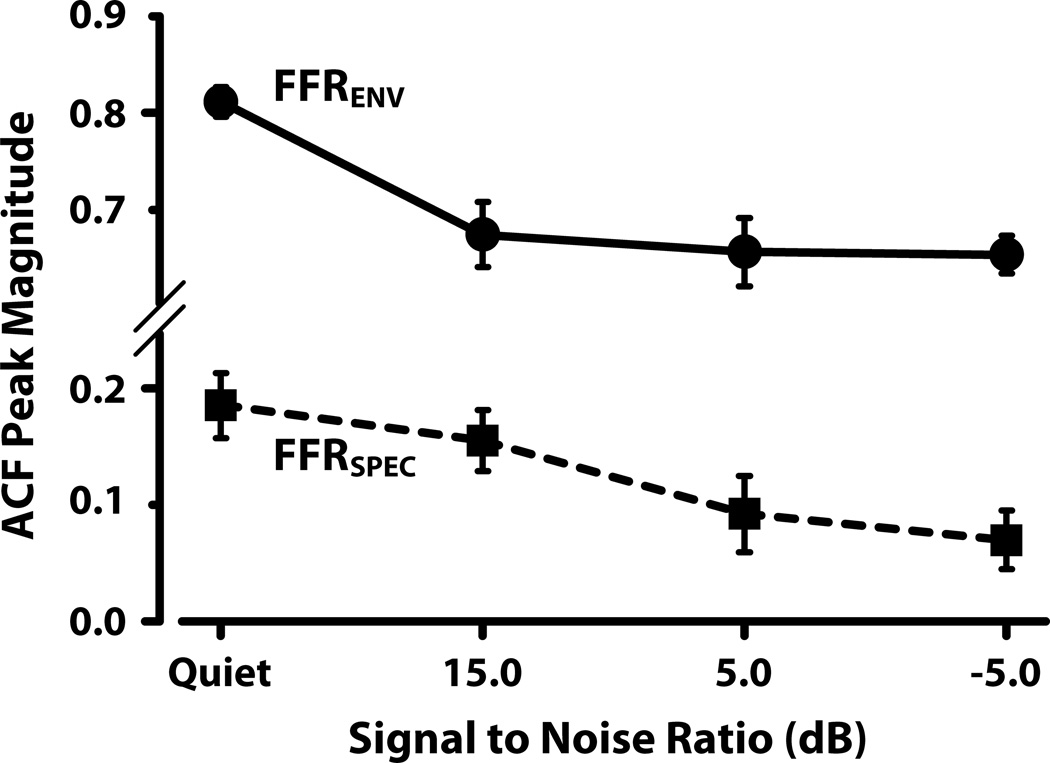
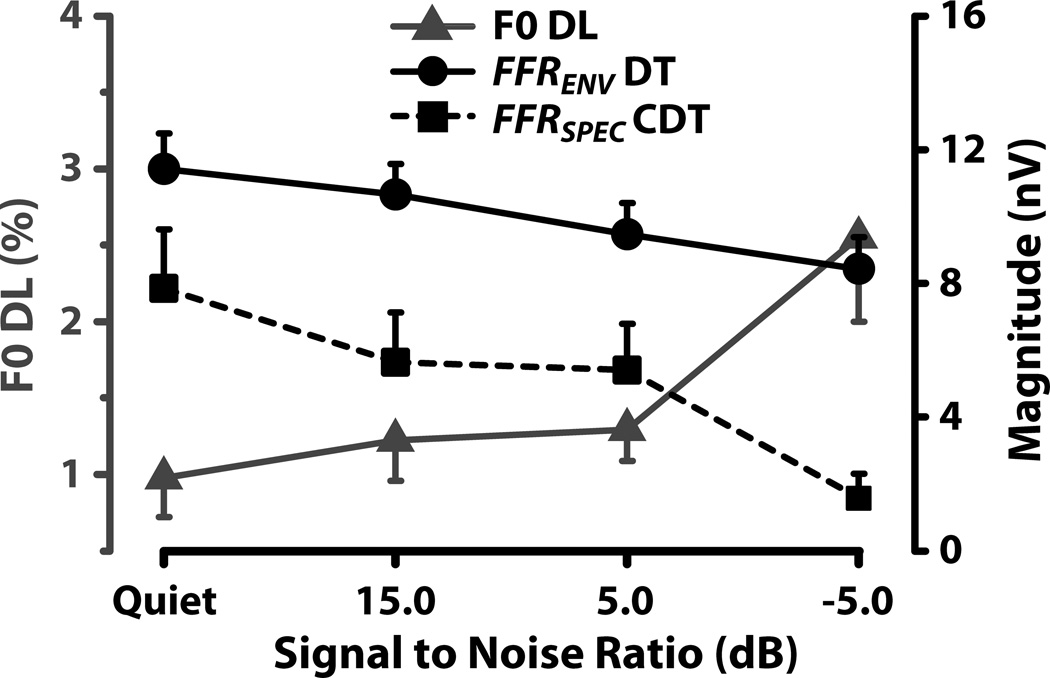
Pitch experiments aimed at evaluating temporal pitch mechanism(s) often utilize complex sounds with only unresolved harmonic components, and a low-pass noise masker to eliminate the potential contribution of audible distortion products to the pitch percept. Herein we examine how: (i) masker induced reduction of neural distortion products (difference tone: DT; and cubic difference tone: CDT) alters the representation of pitch relevant information in the brainstem; and (ii) the pitch salience is altered when distortion products are reduced and/or eliminated. Scalp recorded brainstem frequency following responses (FFR) were recorded in normal hearing individuals using a complex tone with only unresolved harmonics presented in quiet, and in the presence of a low-pass masker at SNRs of +15, +5, and -5 dB. Difference limen for F0 discrimination (F0 DL) was obtained in quiet and in the presence of low-pass noise. Magnitude of DT components (with the exception of components at F0 and 2F0), and the CDT components decreased with increasing masker level. Neural pitch strength decreased with increasing masker level for both the envelope-related (FFR(ENV)) and spectral-related (FFR(SPEC)) phase-locked activity. Finally, F0 DLs increased with decreasing SNRs suggesting poorer F0 discrimination with reduction of the distortion products. Collectively, these findings support the notion that both DT and CDT, as reflected in the FFR(ENV) and FFR(SPEC), respectively, influence both the brainstem representation of pitch relevant information and the pitch salience of the complex sounds.
Copyright © 2012 Elsevier B.V. All rights reserved.
Figures

References
-
- Abel C, Kössl M. Sensitive response to low-frequency cochlear distortion products in the auditory midbrain. Journal of Neurophysiology. 2009;101(3):1560. - PubMed
-
- Aiken SJ, Picton TW. Envelope and spectral frequency-following responses to vowel sounds. Hearing Research. 2008;245(1–2):35–47. - PubMed
-
- Arnold S, Burkard R. The auditory evoked potential difference tone and cubic difference tone measured from the inferior colliculus of the chinchilla. The Journal of the Acoustical Society of America. 1998;104:1565. - PubMed
-
- Bernstein JG, Oxenham AJ. Pitch discrimination of diotic and dichotic tone complexes: Harmonic resolvability or harmonic number? The Journal of the Acoustical Society of America. 2003;113(6):3323–3334. - PubMed
-
- Bhagat S, Champlin C. Evaluation of distortion products produced by the human auditory system. Hearing Research. 2004;193(1–2):51–67. - PubMed
Publication types
MeSH terms
Grants and funding
LinkOut - more resources
Full Text Sources
Miscellaneous
