

Polycomb repressive complex 1 (PRC1) disassembles RNA polymerase II preinitiation complexes
- PMID: 22910904
- PMCID: PMC3476247
- DOI: 10.1074/jbc.M112.397430
Polycomb repressive complex 1 (PRC1) disassembles RNA polymerase II preinitiation complexes
Abstract
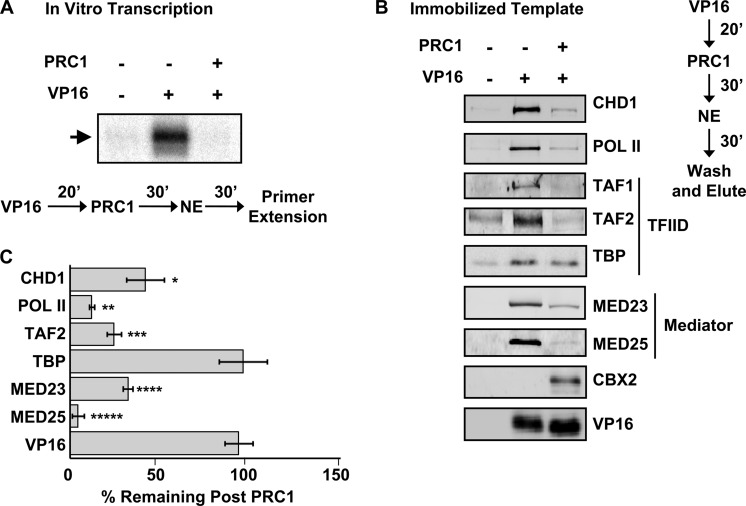
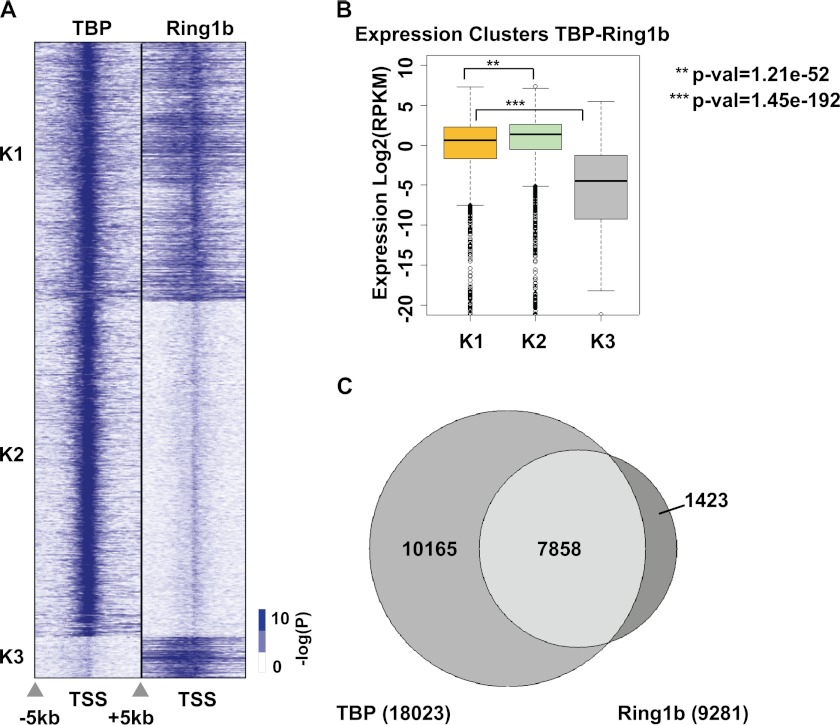
Despite the important role of Polycomb in genome-wide silencing, little is known of the specific biochemical mechanism by which it inactivates transcription. Here we address how recombinant Polycomb repressive complex 1 (PRC1) inhibits activated RNA polymerase II preinitiation complex (PIC) assembly using immobilized H3K27-methylated chromatin templates in vitro. Recombinant PRC1 inhibited transcription, but had little effect on binding of the activator as reported previously. In contrast, Mediator and the general transcription factors were blocked during assembly or dissociated from preassembled PICs. Importantly, among the PIC components, Tata Binding Protein (TBP) was the most resistant to eviction by PRC1. Immobilized template experiments using purified PRC1, transcription factor II D (TFIID), and Mediator indicate that PRC1 blocks the recruitment of Mediator, but not TFIID. We conclude that PRC1 functions to block or dissociate PICs by interfering with Mediator, but leaves TBP and perhaps TFIID intact, highlighting a specific mechanism for PRC1 transcriptional silencing. Analysis of published genome-wide datasets from mouse embryonic stem cells revealed that the Ring1b subunit of PRC1 and TBP co-enrich at developmental genes. Further, genes enriched for Ring1b and TBP are expressed at significantly lower levels than those enriched for Mediator, TBP, and Ring1b. Collectively, the data are consistent with a model in which PRC1 and TFIID could co-occupy genes poised for activation during development.
Figures


Similar articles
-
Comparison of transcriptional initiation by RNA polymerase II across eukaryotic species.Elife. 2021 Sep 13;10:e67964. doi: 10.7554/eLife.67964. Elife. 2021. PMID: 34515029 Free PMC article.
-
Mediator and SAGA have distinct roles in Pol II preinitiation complex assembly and function.Cell Rep. 2012 Nov 29;2(5):1061-7. doi: 10.1016/j.celrep.2012.10.019. Epub 2012 Nov 21. Cell Rep. 2012. PMID: 23177621 Free PMC article.
-
Mediator, TATA-binding protein, and RNA polymerase II contribute to low histone occupancy at active gene promoters in yeast.J Biol Chem. 2014 May 23;289(21):14981-95. doi: 10.1074/jbc.M113.529354. Epub 2014 Apr 11. J Biol Chem. 2014. PMID: 24727477 Free PMC article.
-
Structural insights into assembly of transcription preinitiation complex.Curr Opin Struct Biol. 2022 Aug;75:102404. doi: 10.1016/j.sbi.2022.102404. Epub 2022 Jun 11. Curr Opin Struct Biol. 2022. PMID: 35700575 Review.
-
Roles for BTAF1 and Mot1p in dynamics of TATA-binding protein and regulation of RNA polymerase II transcription.Gene. 2003 Oct 2;315:1-13. doi: 10.1016/s0378-1119(03)00714-5. Gene. 2003. PMID: 14557059 Review.
Cited by
-
Histone modifiers at the crossroads of oncolytic and oncogenic viruses.Mol Ther. 2022 Jun 1;30(6):2153-2162. doi: 10.1016/j.ymthe.2022.02.006. Epub 2022 Feb 8. Mol Ther. 2022. PMID: 35143960 Free PMC article. Review.
-
A functional genetic screen identifies the Mediator complex as essential for SSX2-induced senescence.Cell Death Dis. 2019 Nov 6;10(11):841. doi: 10.1038/s41419-019-2068-1. Cell Death Dis. 2019. PMID: 31695025 Free PMC article.
-
Polycomb group proteins--epigenetic repressors with emerging roles in melanocytes and melanoma.Pigment Cell Melanoma Res. 2015 May;28(3):330-9. doi: 10.1111/pcmr.12341. Epub 2015 Jan 7. Pigment Cell Melanoma Res. 2015. PMID: 25475071 Free PMC article. Review.
-
dBRWD3 Regulates Tissue Overgrowth and Ectopic Gene Expression Caused by Polycomb Group Mutations.PLoS Genet. 2016 Sep 2;12(9):e1006262. doi: 10.1371/journal.pgen.1006262. eCollection 2016 Sep. PLoS Genet. 2016. PMID: 27588417 Free PMC article.
-
The Mediator complex and transcription regulation.Crit Rev Biochem Mol Biol. 2013 Nov-Dec;48(6):575-608. doi: 10.3109/10409238.2013.840259. Epub 2013 Oct 3. Crit Rev Biochem Mol Biol. 2013. PMID: 24088064 Free PMC article. Review.
References
-
- Lewis E. B. (1978) A gene complex controlling segmentation in Drosophila. Nature 276, 565–570 - PubMed
-
- Shao Z., Raible F., Mollaaghababa R., Guyon J. R., Wu C. T., Bender W., Kingston R. E. (1999) Stabilization of chromatin structure by PRC1, a Polycomb complex. Cell 98, 37–46 - PubMed
-
- Plath K., Fang J., Mlynarczyk-Evans S. K., Cao R., Worringer K. A., Wang H., de la Cruz C. C., Otte A. P., Panning B., Zhang Y. (2003) Role of histone H3 lysine 27 methylation in X inactivation. Science 300, 131–135 - PubMed
-
- Cao R., Wang L., Wang H., Xia L., Erdjument-Bromage H., Tempst P., Jones R. S., Zhang Y. (2002) Role of histone H3 lysine 27 methylation in Polycomb-group silencing. Science 298, 1039–1043 - PubMed
Publication types
MeSH terms
Substances
Grants and funding
LinkOut - more resources
Full Text Sources
Molecular Biology Databases
