. 2012 Oct 5;287(41):34614-25.
doi: 10.1074/jbc.M112.397380. Epub 2012 Aug 21.

Multidomain Carbohydrate-binding Proteins Involved in Bacteroides thetaiotaomicron Starch Metabolism

Affiliations

Multidomain Carbohydrate-binding Proteins Involved in Bacteroides thetaiotaomicron Starch Metabolism

Elizabeth A Cameron et al. J Biol Chem. .

Abstract

Human colonic bacteria are necessary for the digestion of many dietary polysaccharides. The intestinal symbiont Bacteroides thetaiotaomicron uses five outer membrane proteins to bind and degrade starch. Here, we report the x-ray crystallographic structures of SusE and SusF, two outer membrane proteins composed of tandem starch specific carbohydrate-binding modules (CBMs) with no enzymatic activity. Examination of the two CBMs in SusE and three CBMs in SusF reveals subtle differences in the way each binds starch and is reflected in their K(d) values for both high molecular weight starch and small maltooligosaccharides. Thus, each site seems to have a unique starch preference that may enable these proteins to interact with different regions of starch or its breakdown products. Proteins similar to SusE and SusF are encoded in many other polysaccharide utilization loci that are possessed by human gut bacteria in the phylum Bacteroidetes. Thus, these proteins are likely to play an important role in carbohydrate metabolism in these abundant symbiotic species. Understanding structural changes that diversify and adapt related proteins in the human gut microbial community will be critical to understanding the detailed mechanistic roles that they perform in the complex digestive ecosystem.


Figures

FIGURE 1.
FIGURE 1.
SusE and SusF are exposed on the surface of B. thetaiotaomicron. Alleles of susE and susF were created in which the N-terminal cysteine, which is lipidated to tether the proteins to the outer membrane, was mutated to alanine (SusE C21A and SusF C20A). These alleles were recombined into the native sus locus. Cells were grown to mid-exponential phase in minimal media/maltose to induce expression. A, Bt staining for SusE and SusF surface expression. Nonpermeabilized cells were fixed and probed for SusE and SusF surface expression using polyclonal antisera. Fluorescent images are shown with the corresponding bright field (BF) images. All images are shown on the same scale; bar = 10 μm. B, Western blot of lysates from whole cells expressing the wild-type and mutant alleles probed in A. Wild-type (1), SusE C21A (2), SusF C20A (3), and SusE C21A SusF C20A (4) Bt whole cell lysates were probed for SusE and SusF protein using polyclonal antibodies. Size difference between the wild-type and lipidation signal mutant proteins corresponds to loss of the lipid tail.
FIGURE 2.
FIGURE 2.
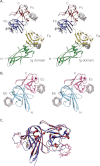
Ribbon diagram of SusE and SusF structures. A, schematic representation of SusF (residues 40–485), with the IgSF domain (residues 40–160) in green, CBM Fa (residues 161–172) in yellow, CBM Fb (residues 275–383) in blue, and CBM Fc (residues 384–485) in red. Bound M7 is displayed as red and white sticks. The electron density from an omit map, contoured at 2.5 σ is shown for the ligands. Note that the M7 observed at Fa and Fc is shared across a crystallographic symmetry axis, and therefore the electron density is the same. B, schematic representation of SusE (residues 174–387), with CBM Eb (residues 174–283) colored aqua and CBM Ec (residues 284–385) colored pink. Bound αCD is displayed as red and gray sticks. Electron density for αCD from an omit map is displayed and contoured at 2 σ. The ligand observed at Eb and Ec is shared across a crystallographic symmetry axis, and therefore the electron density is the same. C, overlay of the SusE CBM Eb and Ec domains (blue) with the SusF CBM Fb and Fc domains (red). The r.m.s. deviation of the models is 1.3 Å for 189 Cα atoms. The ligand αCD bound to SusE is shown as light blue sticks, and the maltotetraose and M7 bound to SusF are shown as pink sticks.
FIGURE 3.
FIGURE 3.
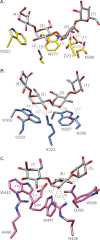
Close-up view of the three starch-binding sites in SusF. In each panel, M7 is shown as gray and red sticks and the amino acids involved in binding displayed. Dashed lines depict the hydrogen-bonding network between the ligand and protein and distances are shown in Å. Note that in panels A and C, only the portion of the ligand involved in protein binding is displayed. Glucose residues are numbered with glucose (1) indicating the nonreducing end of the maltooligosaccharide. The interactions are shown for A. CBM Fa, displaying only glucoses 1–4; B, CBM Fb (note that only four of the possible seven glucose units were resolved in the electron density); C, CBM Fc, displaying only glucoses 5–7.
FIGURE 4.
FIGURE 4.
Close-up view of the starch-binding sites in SusE. Panels A and B depict the structure of SusE with αCD, whereas panels C–E depict the structure of the C-terminal half of SusE with maltoheptaose. A, αCD binding at CBM Eb, with the ligand as gray and red sticks, and the amino acids involved in binding displayed. Dashed lines depict the hydrogen-bonding network between the ligand and protein and distances are shown in Å. Note that only the glucose residues involved in binding are displayed. Glucose residues are numbered with glucose (1) indicating the nonreducing end of the maltooligosaccharide. B, αCD binding at CBM Ec, as described for panel A. Leu-354 was omitted for clarity. For a stereo view of this site, see supplemental Fig. S2. C, M7 bound at Ec (chain A) demonstrating the curvature of the ligand and the manner in which it extends over the loop created by residues 353–357. D, M7 bound at CBM Ec (chain B). Electron density for maltoheptaose was generated from an omit map, contoured at 3 σ. Note that due to crystallographic symmetry the ligand in panels C and D are the same molecule and thus electron density is only displayed in one panel. E, overlay of M7 bound by chains A (purple) and B (pink) at CBM-Ec, demonstrating the manner in which this site may accommodate a longer molecule of starch.
FIGURE 5.
FIGURE 5.
Protein binding to insoluble cornstarch. Bound protein per gram of starch is plotted as a function of free protein concentration with error bars representing the S.E. from three replicates. Data were fit to a one-site total binding equation. A, WT SusE and SusF; B, WT SusF and mutant forms of SusF where one of the binding sites has been mutated (SusF A*, SusF B*, and SusF C*); C, WT SusF with mutant forms of SusF where only one binding site remains intact (SusF A only, SusF B only, and SusF C only) or where all binding sites were mutated (SusF no binding); D, WT SusE and mutant forms of SusE where only one of the binding sites remains intact (SusE B only, SusE C only) or both binding sites were mutated (SusE no binding).
FIGURE 6.
FIGURE 6.
Model of Sus outer membrane protein interactions with starch. In total, the four outer membrane lipoproteins in the Bt starch-utilization system contain at least nine sites that interact with starch or cleaved maltooligosaccharides. Only one of these sites (Gcat) is catalytic and present in the endo-acting amylase, SusG. The remaining eight binding sites are spread across all four lipoproteins. In the model shown, these eight sites make interactions with different regions of a single starch polymer. The nature of potential interactions between individual Sus liproteins has not been explored, nor has the stoichiometry of these proteins on the cell surface.

References

    1. Flint H. J., Bayer E. A., Rincon M. T., Lamed R., White B. A. (2008) Polysaccharide utilization by gut bacteria. Potential for new insights from genomic analysis. Nat. Rev. Microbiol. 6, 121–131 - PubMed
    1. Koropatkin N. M., Cameron E. A., Martens E. C. (2012) How glycans shape the human gut microbiota. Nat. Rev. Microbiol. 10, 323–335 - PMC - PubMed
    1. McNeil N. I. (1984) The contribution of the large intestine to energy supplies in man. Am. J. Clin. Nutr. 39, 338–342 - PubMed
    1. Turnbaugh P. J., Ley R. E., Mahowald M. A., Magrini V., Mardis E. R., Gordon J. I. (2006) An obesity-associated gut microbiome with increased capacity for energy harvest. Nature 444, 1027–1031 - PubMed
    1. Ley R. E., Hamady M., Lozupone C., Turnbaugh P. J., Ramey R. R., Bircher J. S., Schlegel M. L., Tucker T. A., Schrenzel M. D., Knight R., Gordon J. I. (2008) Evolution of mammals and their gut microbes. Science 320, 1647–1651 - PMC - PubMed

Publication types

LinkOut - more resources