. 2012 Oct 19;287(43):35899-911.
doi: 10.1074/jbc.M112.366419. Epub 2012 Aug 21.

The peroxisome proliferator-activated receptor γ (PPARγ) controls natural protective mechanisms against lipid peroxidation in amyotrophic lateral sclerosis

Affiliations

The peroxisome proliferator-activated receptor γ (PPARγ) controls natural protective mechanisms against lipid peroxidation in amyotrophic lateral sclerosis

Valeria Benedusi et al. J Biol Chem. .

Abstract

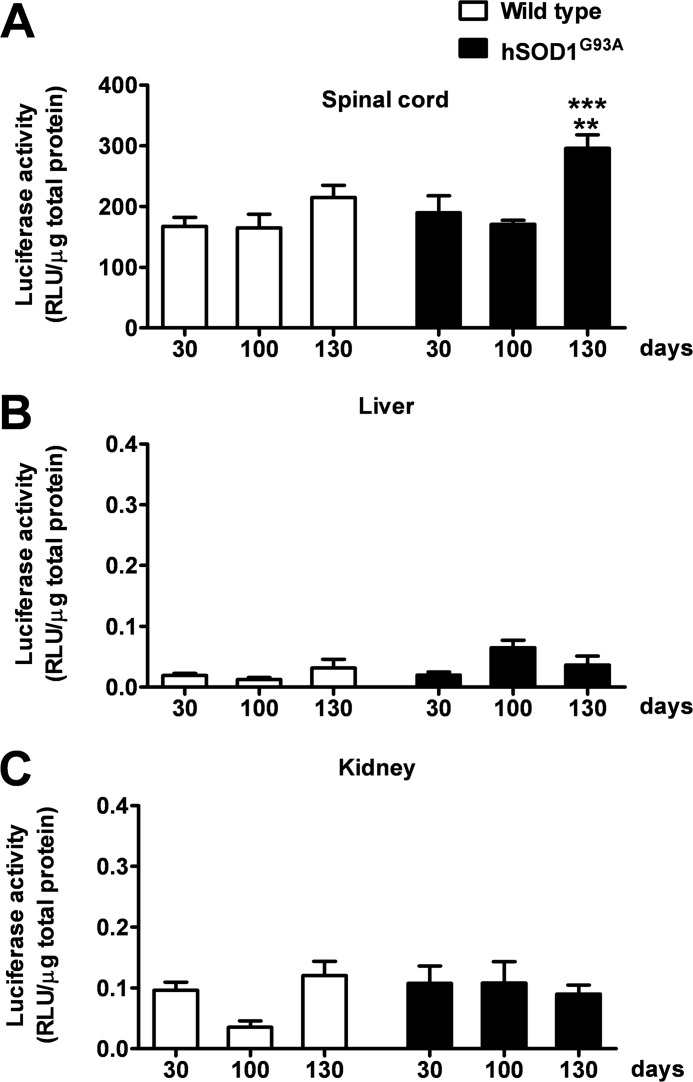
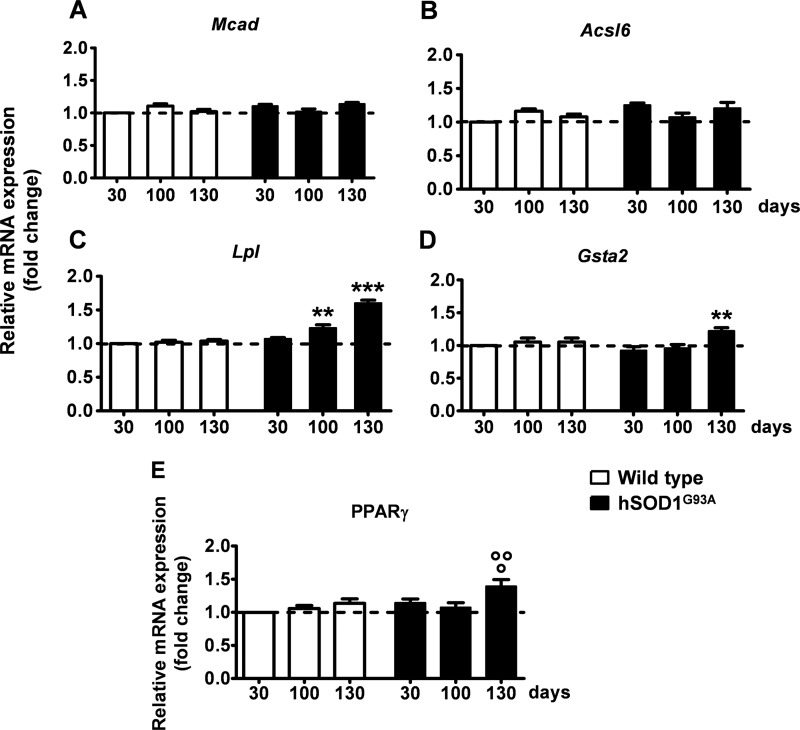
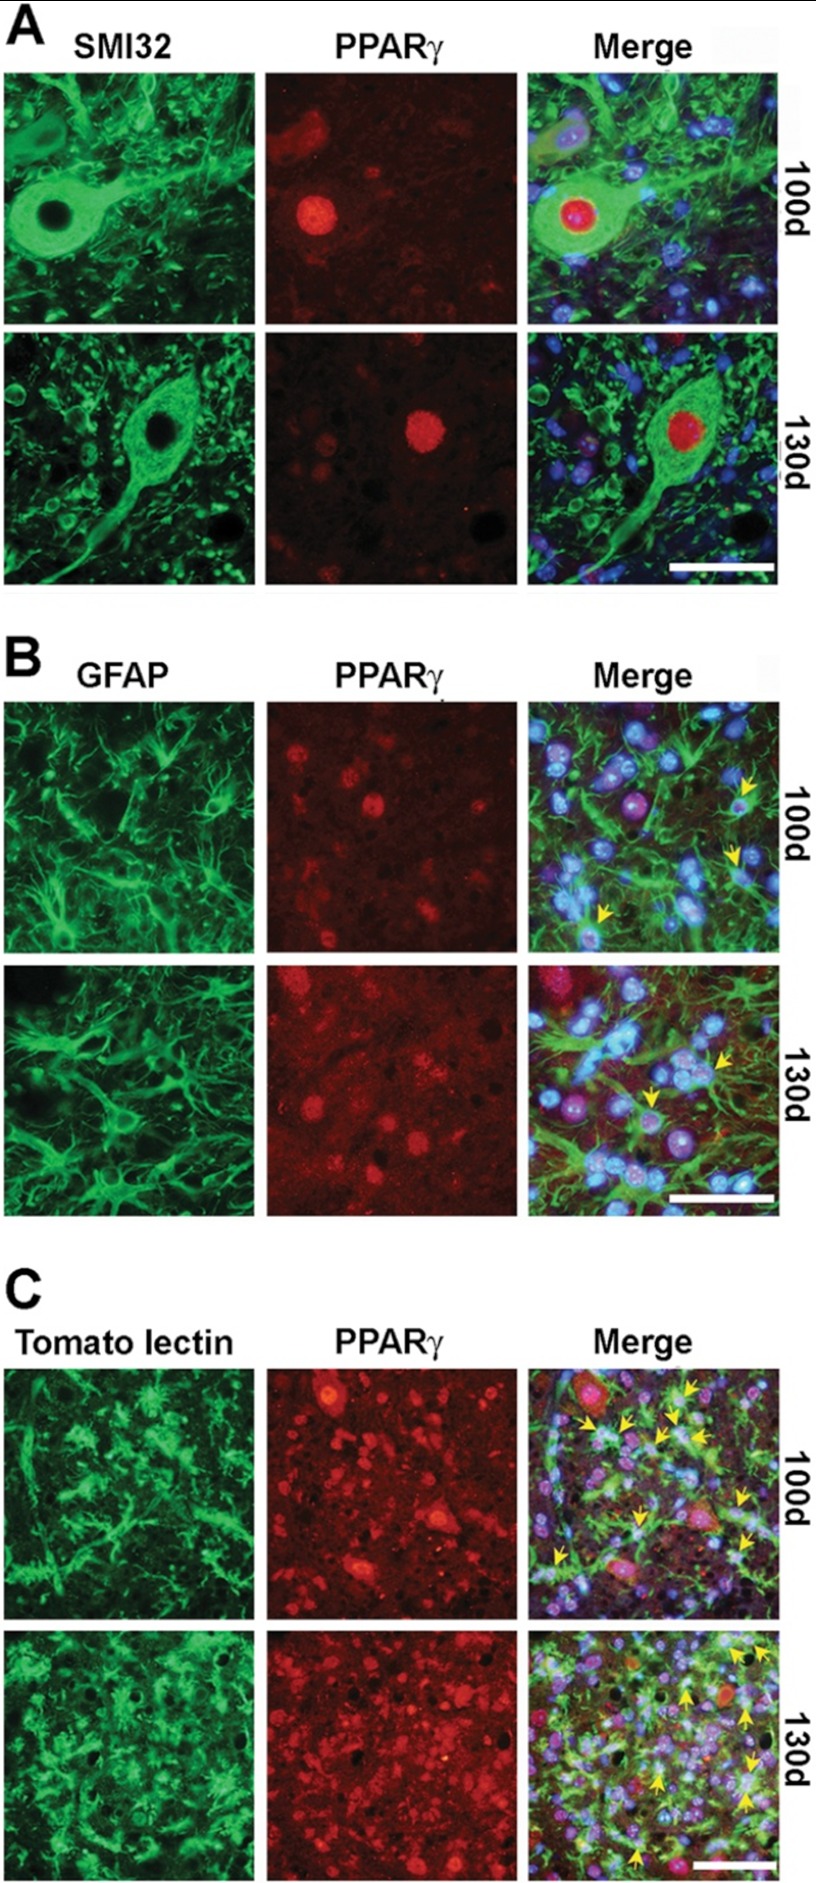
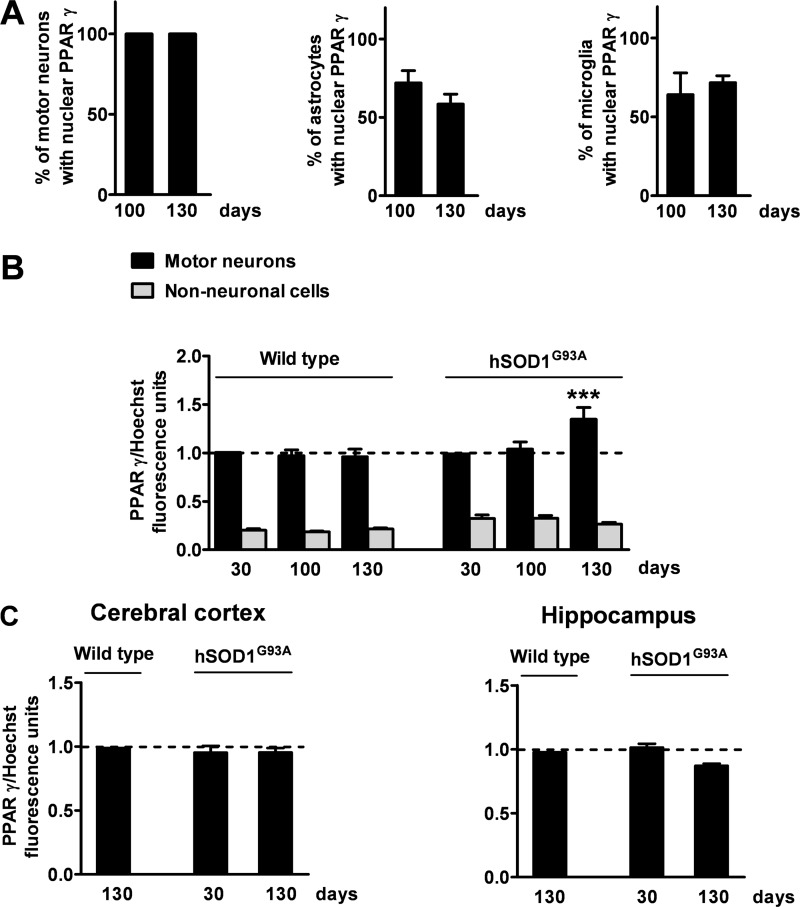
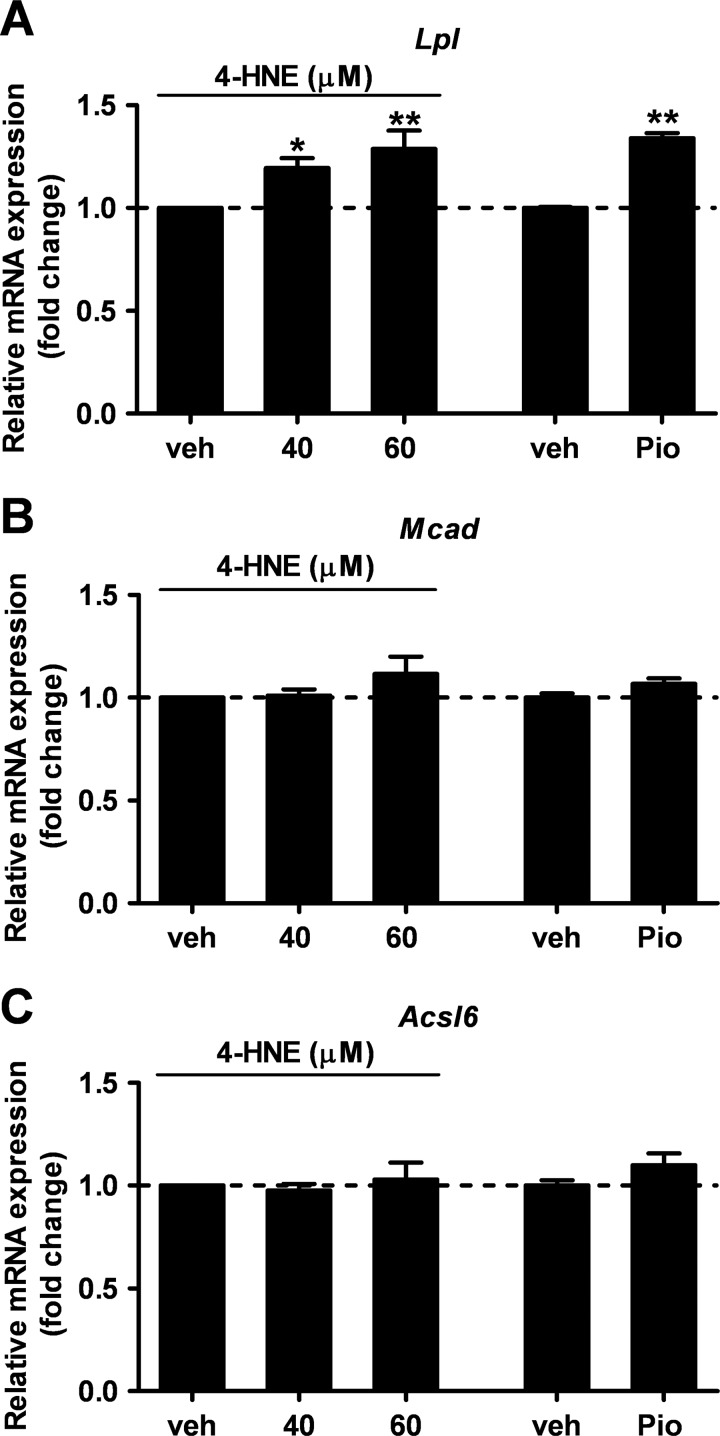
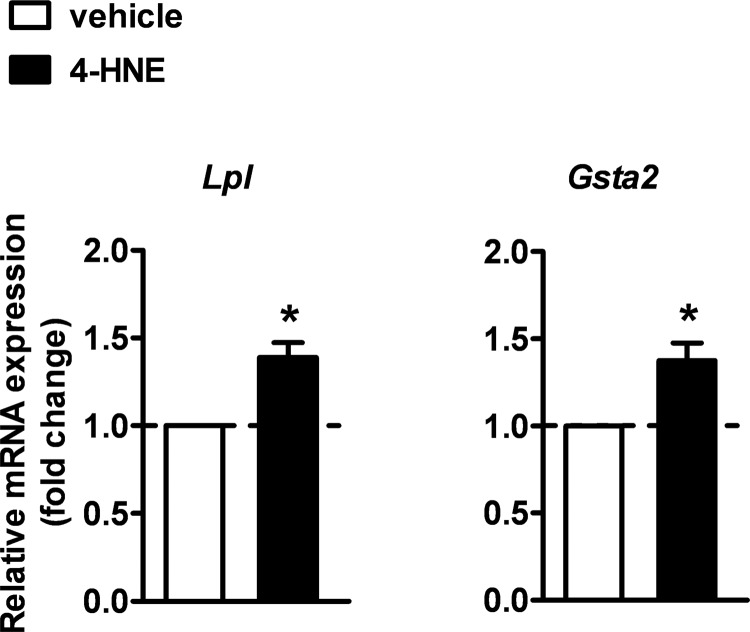
Recent evidence highlights the peroxisome proliferator-activated receptors (PPARs) as critical neuroprotective factors in several neurodegenerative diseases, including amyotrophic lateral sclerosis (ALS). To gain new mechanistic insights into the role of these receptors in the context of ALS, here we investigated how PPAR transcriptional activity varies in hSOD1(G93A) ALS transgenic mice. We demonstrate that PPARγ-driven transcription selectively increases in the spinal cord of symptomatic hSOD1(G93A) mice. This phenomenon correlates with the up-regulation of target genes, such as lipoprotein lipase and glutathione S-transferase α-2, which are implicated in scavenging lipid peroxidation by-products. Such events are associated with enhanced PPARγ immunoreactivity within motor neuronal nuclei. This observation, and the fact that PPARγ displays increased responsiveness in cultured hSOD1(G93A) motor neurons, points to a role for this receptor in neutralizing deleterious lipoperoxidation derivatives within the motor cells. Consistently, in both motor neuron-like cultures and animal models, we report that PPARγ is activated by lipid peroxidation end products, such as 4-hydroxynonenal, whose levels are elevated in the cerebrospinal fluid and spinal cord from ALS patients. We propose that the accumulation of critical concentrations of lipid peroxidation adducts during ALS progression leads to the activation of PPARγ in motor neurons. This in turn triggers self-protective mechanisms that involve the up-regulation of lipid detoxification enzymes, such as lipoprotein lipase and glutathione S-transferase α-2. Our findings indicate that anticipating natural protective reactions by pharmacologically modulating PPARγ transcriptional activity may attenuate neurodegeneration by limiting the damage induced by lipid peroxidation derivatives.


Figures

FIGURE 1.
FIGURE 1.
PPAR transcriptional activity increases at the symptomatic stage of ALS disease in the spinal cord of hSOD1G93A mice. The spinal cord (A), liver (B), and kidney (C) of PPRE-Luc+/−; hSOD1G93A−/− (Wild type) and PPRE-Luc+/−; hSOD1G93A+/− (hSOD1G93A) mice were taken at the critical stages of the pathology, i.e. 30 (asymptomatic stage), 100 (onset of motor impairment), and about 130 days of age (symptomatic stage) (n = 5–7 mice per time point per genotype). Luciferase enzymatic activity was determined as surrogate of PPAR transcriptional activity on tissue extracts. Data are expressed as mean ± S.E. **, p < 0.01 versus hSOD1G93A at 30 days of age; ***, p < 0.001 versus hSOD1G93A at 100 days of age, two-way ANOVA followed by Bonferroni post-hoc test. RLU, relative light units.
FIGURE 2.
FIGURE 2.
Starvation does not increase PPAR transcriptional activity in the mouse spinal cord. PPRE-Luc+/− mice were fed ad libitum or starved for 48 h. Spinal cords were collected and luciferase enzymatic activity was evaluated (n = 2 mice per each condition). Data are expressed as mean ± S.E. No significant difference was found between the two experimental groups. p = 0.97, unpaired t test. RLU, relative light units.
FIGURE 3.
FIGURE 3.
Enhanced expression of PPARγ and its transcriptional target genes in the spinal cord of hSOD1G93A ALS mice at the symptomatic stage of the disease. Expression of PPAR isoform-specific target genes was determined in the spinal cord of wild-type and hSOD1G93A mice of different ages by semi-quantitative RT-PCR analysis (n = 5–7 mice per time point per genotype). A, Mcad was selected as endogenous target gene for PPARα; B, Acsl6 for PPARβ/δ; C, Lpl; and D, Gsta2 for PPARγ. E, endogenous PPARγ mRNA was quantified in the spinal cord of wild-type and hSOD1G93A mice (n = 5–7 mice per time point per genotype). Results were expressed as fold-change versus 30-day-old wild-type mice. Data are expressed as mean ± S.E. **, p < 0.01 versus hSOD1G93A at 30 days of age; ***, p < 0.001 versus hSOD1G93A at 30 days of age; °, p < 0.05 versus hSOD1G93A at 30 days of age; °°, p < 0.01 versus hSOD1G93A at 100 days of age, two-way ANOVA followed by Bonferroni post-hoc test.
FIGURE 4.
FIGURE 4.
Persistent nuclear localization of PPARγ in both motor neurons and glial cells in the spinal cord of symptomatic hSOD1G93A ALS mice. Double immunofluorescence staining for PPARγ and SMI32 (A), GFAP (B), or tomato lectin (C) shows intense nuclear staining of PPARγ in motor neurons, astrocytes, and microglial cells, respectively. Scale bars, 50 μm.
FIGURE 5.
FIGURE 5.
The nuclear concentration of PPARγ is quantitatively enhanced in spinal motor neurons from hSOD1G93A mice at the symptomatic stage of the disease. A, the number of motor neurons, astrocytes, or microglial cells showing PPARγ into the nucleus was determined on spinal cord sections from hSOD1G93A mice taken at 100 (100d) or 130 days of age (130d). Data are expressed as percentage of motor neurons, astrocytes, or microglial cells with nuclear PPARγ out of the total number of cells taken into consideration (n = 40 motor neurons per mouse, n = 45 astrocytes per mouse, n = 100 microglial cells per mouse; n = 5–6 mice per time point). B, the intensity of PPARγ immunofluorescence in the nuclei of motor neurons and non-neuronal cells was determined on lumbar spinal cord sections from wild-type and hSOD1G93A mice stained for PPARγ, the neuronal marker SMI32 and the nuclear dye Hoechst 33342 (n = 15 motor neurons per mouse, n = 30 non-neuronal cells per mouse; n = 3–6 mice per time point). C, the intensity of PPARγ immunofluorescence in the nuclei of cortical and hippocampal neurons was determined on brain sections from hSOD1G93A mice stained for PPARγ, the neuronal marker neuronal nuclei and the nuclear dye Hoechst 33342 (n = 30 cortical neurons per mouse, n = 30 hippocampal neurons per mouse; n = 3 mice per time point). Values were normalized relative to fluorescence intensity of Hoechst 33342, as a measure of DNA content. Data are expressed as mean ± S.E. ***, p < 0.001 versus hSOD1G93A motor neurons at 30 and 100 days of age and wild-type at 130 days of age, two-way ANOVA followed by Bonferroni post hoc test.
FIGURE 6.
FIGURE 6.
Muscle atrophy does not increase the nuclear concentration of PPARγ within spinal motor neurons. A, morphometric analysis of soleus and tibialis anterior muscle fibers from C57Bl/6J wild-type mice at 30 days and 28 months of age. Histograms represent the mean ± S.E. of the minimal Feret's diameter of the soleus and tibialis anterior muscle fibers (n = 3 mice for each age). B, quantification of motor neurons in the lumbar tract of the spinal cord from C57Bl/6J mice at 30 days and 28 months of age. Histograms represent the mean ± S.E. of the total number of motor neurons from 9 disectors per mouse (n = 3 mice for each age). C, the intensity of PPARγ immunofluorescence in the nuclei of motor neurons and non-neuronal cells was determined on lumbar spinal cord sections from 30-day-old and 28-month-old mice stained for PPARγ, the neuronal marker SMI32 and the nuclear dye Hoechst 33342 (n = 32 motor neurons per mouse, n = 90 non-neuronal cells per mouse; n = 3 mice per time point). Values were normalized relative to fluorescence intensity of Hoechst 33342, as a measure of DNA content. Data are expressed as mean ± S.E. ***, p < 0.0001 versus 30-day-old C57Bl/6J mice, unpaired t test.
FIGURE 7.
FIGURE 7.
Mutant SOD1-expressing neuronal cells are highly responsive to PPARγ activation in vitro. A, PPAR transcriptional activity was determined in the motor neuron-like NSC-34, astrocytic P0–17D, and microglial BV-2 cell lines transiently co-transfected with the PPRE5X-tk-Luc plasmid and vectors encoding either hSOD1WT or hSOD1G93A. Renilla luciferase was used as a transfection control. Cells were treated in the absence or presence of 30 μm pioglitazone for 24 h and assayed for luciferase enzymatic activity (n = 3–6 in triplicate). Firefly luciferase levels were normalized to Renilla luciferase values. B and C, expression of the PPARγ target genes Lpl and Gsta2 was determined by semiquantitative RT-PCR analysis in primary neuronal (B) and mixed glial cultures (C) prepared from the spinal cord of wild-type and hSOD1G93A mice. Cells were treated in the absence and presence of 30 μm pioglitazone for 24 h (n = 3 cultures per cell type). Data are expressed as mean ± S.E. *, p < 0.05 versus hSOD1WT; **, p < 0.01 versus hSOD1WT + pioglitazone; §, p < 0.01 versus hSOD1G93A; §§, p < 0.001 versus hSOD1WT; §§§, p < 0.001 versus hSOD1G93A; °, p < 0.05 versus wild type; °°, p < 0.05 versus wild type + pioglitazone; °°°, p < 0.001 versus wild type + pioglitazone, two-way ANOVA followed by Bonferroni post-hoc test.
FIGURE 8.
FIGURE 8.
The lipid peroxidation adduct 4-HNE, but not the oxidant hydrogen peroxide, triggers PPAR transcriptional activation in cultured motor neuron-like cells. NSC-34 cells were transiently transfected with the PPRE5X-tk-Luc plasmid and treated with increasing concentrations of H2O2 (A) or 4-HNE (B) for 24 h (n = 3 in triplicate). Pioglitazone (30 μm, Pio) was used as positive control and the vehicle (veh) as negative control. Cell lysates were assayed for luciferase enzymatic activity, and firefly luciferase levels were normalized to the transfection control, Renilla luciferase. Data are expressed as mean ± S.E. °°°, p < 0.001 versus vehicle, H2O2, 10, 50, and 100 μm; **, p < 0.05 versus vehicle; ***, p < 0.01 versus vehicle, 4-HNE, 10 m and 20 μm, one-way ANOVA followed by Bonferroni post hoc test.
FIGURE 9.
FIGURE 9.
4-HNE specifically enhances the expression of the PPARγ target gene Lpl in cultured motor neuron-like cells. Expression of PPAR isoform-specific target genes, i.e. Lpl for PPARγ (A), Mcad for PPARα (B), and Acsl6 for PPARβ/δ (C), was analyzed in NSC-34 cells treated with the vehicle (veh), 4-HNE (40 or 60 μm), or pioglitazone (30 μm) for 24 h (n = 3 in triplicate). Data are expressed as mean ± S.E. *, p < 0.05 versus vehicle; **, p < 0.01 versus vehicle, one-way ANOVA followed by Newman-Keuls post hoc test.
FIGURE 10.
FIGURE 10.
4-HNE enhances the expression of PPARγ target genes Lpl and Gsta2 in vivo in the spinal cord of wild-type mice. Mice were intracerebroventricularly injected with 4-HNE (5 nmol/mouse) or vehicle and the expression of Lpl and Gsta2 was analyzed in the spinal cord after 3 h by semi-quantitative RT-PCR analysis (n = 4–5 mice per each experimental group). Data are expressed as mean ± S.E. *, p < 0.05 versus vehicle, unpaired t test.

References

    1. Rosen D. R., Siddique T., Patterson D., Figlewicz D. A., Sapp P., Hentati A., Donaldson D., Goto J., O'Regan J. P., Deng H. X. (1993) Mutations in Cu/Zn-superoxide dismutase gene are associated with familial amyotrophic lateral sclerosis. Nature 362, 59–62 - PubMed
    1. Gurney M. E., Pu H., Chiu A. Y., Dal Canto M. C., Polchow C. Y., Alexander D. D., Caliendo J., Hentati A., Kwon Y. W., Deng H. X. (1994) Motor neuron degeneration in mice that express a human Cu,Zn-superoxide dismutase mutation. Science 264, 1772–1775 - PubMed
    1. Bruijn L. I., Becher M. W., Lee M. K., Anderson K. L., Jenkins N. A., Copeland N. G., Sisodia S. S., Rothstein J. D., Borchelt D. R., Price D. L., Cleveland D. W. (1997) ALS-linked SOD1 mutant G85R mediates damage to astrocytes and promotes rapidly progressive disease with SOD1-containing inclusions. Neuron 18, 327–338 - PubMed
    1. Wong P. C., Pardo C. A., Borchelt D. R., Lee M. K., Copeland N. G., Jenkins N. A., Sisodia S. S., Cleveland D. W., Price D. L. (1995) An adverse property of a familial ALS-linked SOD1 mutation causes motor neuron disease characterized by vacuolar degeneration of mitochondria. Neuron 14, 1105–1116 - PubMed
    1. Turner B. J., Talbot K. (2008) Transgenics, toxicity, and therapeutics in rodent models of mutant SOD1-mediated familial ALS. Prog. Neurobiol. 85, 94–134 - PubMed

Publication types

MeSH terms