. 2012;8(7):e1002811.
doi: 10.1371/journal.ppat.1002811. Epub 2012 Jul 26.

Type I interferons promote fatal immunopathology by regulating inflammatory monocytes and neutrophils during Candida infections

Affiliations

Type I interferons promote fatal immunopathology by regulating inflammatory monocytes and neutrophils during Candida infections

Olivia Majer et al. PLoS Pathog. 2012.

Abstract

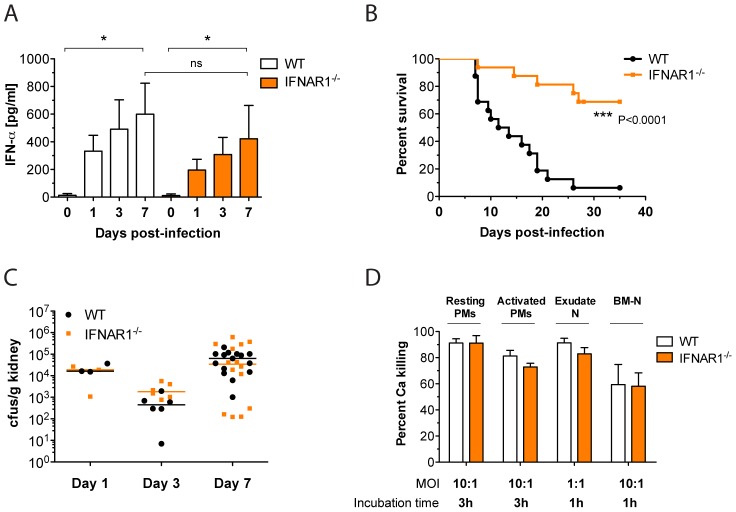
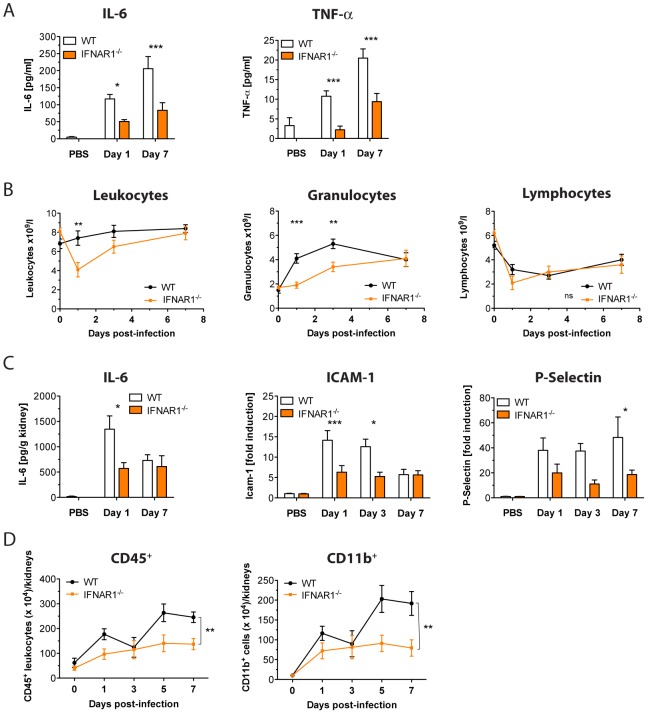
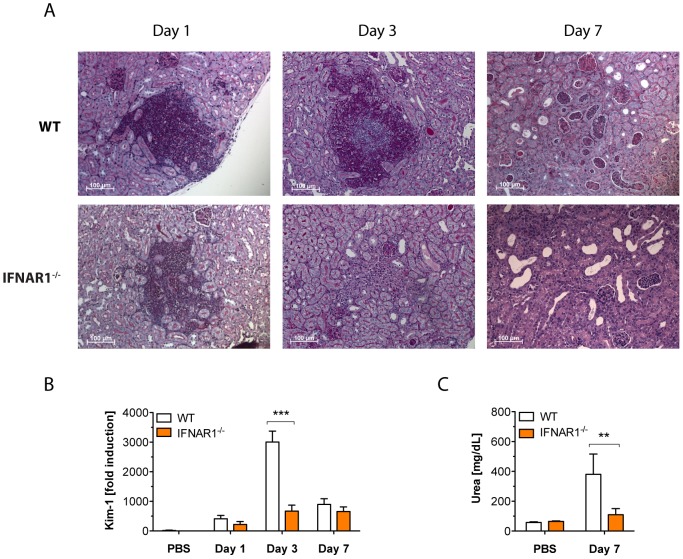
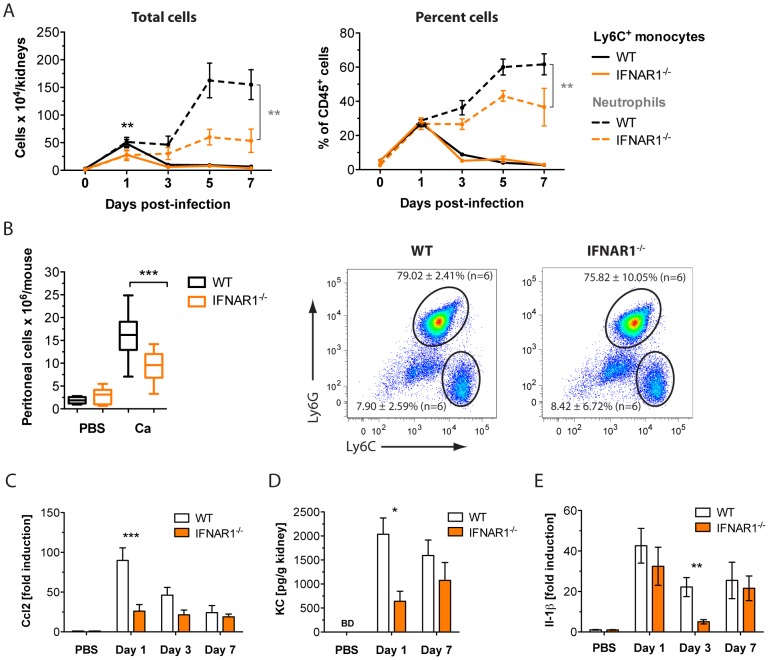
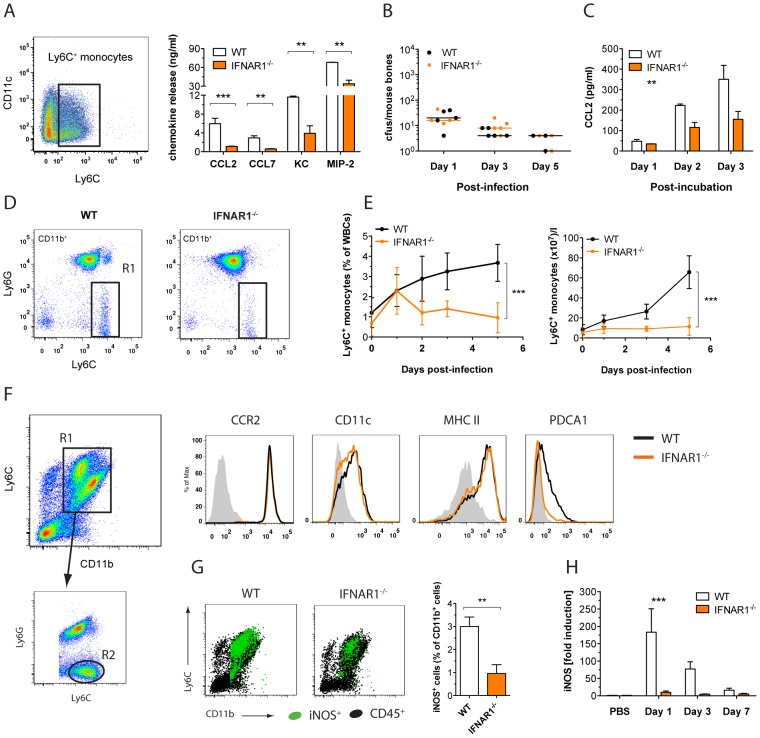
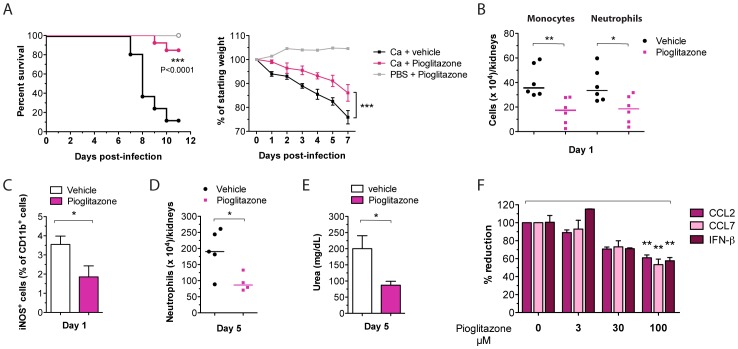
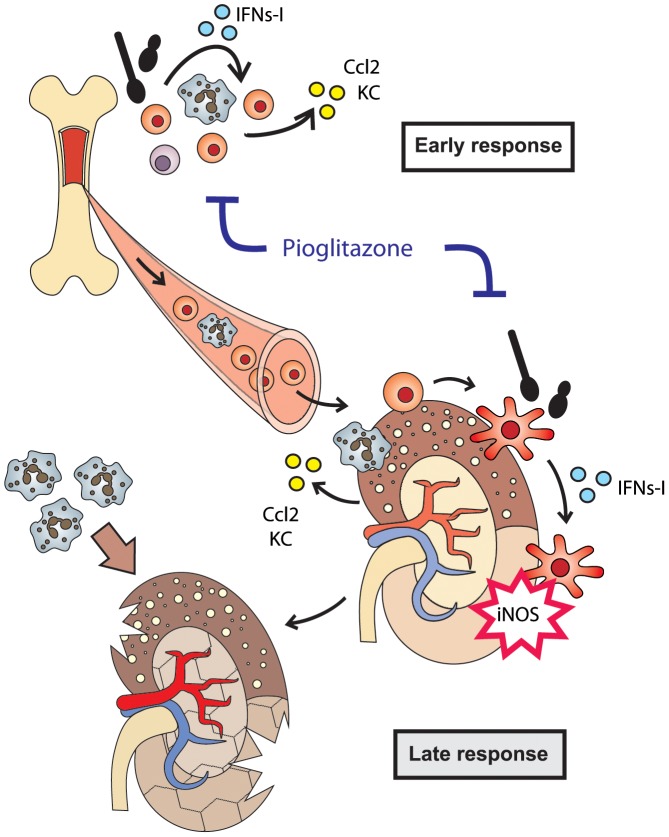
Invasive fungal infections by Candida albicans (Ca) are a frequent cause of lethal sepsis in intensive care unit patients. While a contribution of type I interferons (IFNs-I) in fungal sepsis remains unknown, these immunostimulatory cytokines mediate the lethal effects of endotoxemia and bacterial sepsis. Using a mouse model lacking a functional IFN-I receptor (Ifnar1⁻/⁻), we demonstrate a remarkable protection against invasive Ca infections. We discover a mechanism whereby IFN-I signaling controls the recruitment of inflammatory myeloid cells, including Ly6C(hi) monocytes and neutrophils, to infected kidneys by driving expression of the chemokines CCL2 and KC. Within kidneys, monocytes differentiate into inflammatory DCs but fail to functionally mature in Ifnar1⁻/⁻ mice, as demonstrated by the impaired upregulation of the key activation markers PDCA1 and iNOS. The increased activity of inflammatory monocytes and neutrophils results in hyper-inflammation and lethal kidney pathology. Pharmacological diminution of monocytes and neutrophils by treating mice with pioglitazone, a synthetic agonist of the nuclear receptor peroxisome proliferator-activated receptor-γ (PPAR-γ), strongly reduces renal immunopathology during Ca infection and improves mouse survival. Taken together, our data connect for the first time the sepsis-promoting functions of IFNs-I to the CCL2-mediated recruitment and the activation of inflammatory monocytes/DCs with high host-destructing potency. Moreover, our data demonstrate a therapeutic relevance of PPAR-γ agonists for microbial infectious diseases where inflammatory myeloid cells may contribute to fatal tissue damage.


Conflict of interest statement

The authors have declared that no competing interests exist.

Figures

Figure 1
Figure 1. Ca induces a detrimental IFN-I response during infection.
(A) Mice of the indicated genotype were iv injected with a lethal dose of 1×10⁵ cfus Ca. Serum was collected at indicated time points, and IFN-α concentrations were determined using a multiplex bead array system. Data presented show the mean ± SEM of two independent experiments (n = 6–8 mice per group). (B) Mice were injected as in (A) and survival was monitored for 35 days. The data are presented as Kaplan-Meier survival curves and are a summary of three independent experiments (n = 16 mice per group). (C) Mice were injected with 0.5×10⁵ cfus Ca. At indicated time points, Ca cfus in kidneys were determined and expressed as cfus/g organ. Data presented are a summary of three independent experiments (n = 3–15 mice per group). Each symbol represents one mouse; horizontal bars indicate the calculated median. (D) Resting and activated peritoneal macrophages (PMs), exudate neutrophils (N), and bone marrow neutrophils (BM-N) were stimulated with Ca at the indicated multiplicities of infection and for indicated time periods. Percentage of Ca killing was determined by counting cfus. Data presented are from single experiments with at least 4 replica wells per condition.
Figure 2
Figure 2. IFN-I signaling promotes hyper-inflammatory immune responses.
Mice of the indicated genotype were injected with a lethal dose of 1×10⁵ cfus Ca. At indicated time points, serum/whole blood and kidneys were collected. (A) Sera concentrations of IL-6 and TNF-α were measured using a multiplex bead array system. Data presented show the mean ± SEM of four independent experiments (n = 7–12 mice per group). (B) Blood cell populations were analysed by an automated blood counter. Data presented show the mean ± SEM of two independent experiments (n = 6–8 mice per group). Plotted are the absolute numbers of leukocytes, granulocytes, and lymphocytes expressed as cell number ×109/l. (C) IL-6 concentrations in kidney supernatants were measured using a multiplex bead array system. Gene expression levels of Icam-1 and P-Selectin were quantified by qPCR in kidney total RNA. Data presented show the mean ± SEM of three independent experiments (n = 7–12 mice per group). (D) Kidney leukocytes were enriched and characterized by multi-label flow cytometry. Graphs show absolute numbers of leukocytes (CD45+) and myeloid cells (CD11b+) per total mouse kidneys. Data presented is one representative of two independent experimental repeats (n = 3–5 mice per group).
Figure 3
Figure 3. Reduced immunopathology protects Ifnar1−/− mice from kidney injury.
Mice of the indicated genotype were injected with a lethal dose of 1×10⁵ cfus Ca. At indicated time points, serum and kidneys were collected. (A) Histopathology of the cortical part of kidneys at day 1, 3 and 7 post infection. Longitudinal sections of paraffin-embedded organs were stained with periodic acid-Schiff (PAS) to visualize fungal cells. Counterstaining was performed with hematoxylin. (n = 3–4 mice per group) (B) Kidney total RNA was analysed for gene expression of kidney injury marker-1 (Kim-1). Data presented show the mean ± SEM of three independent experiments (n = 8–10 mice per group). (C) Urea concentration in serum. Data presented show the mean ± SEM of two independent experiments (n = 7–9 mice per group).
Figure 4
Figure 4. IFN-I signaling promotes inflammatory phagocyte influx to infected sites.
(A, C–E) Mice of the indicated genotype were injected with a lethal dose of 1×10⁵ cfus Ca. At indicated time points, kidneys were collected. (A) Kidney leukocytes were enriched and characterized by multi-label flow cytometry. Graphs show absolute numbers of inflammatory monocytes and neutrophils per total mouse kidneys (left) and percent of CD45+ cells (right). Data presented is one representative of two independent experimental repeats (n = 3–5 mice per group). (B) Mice of the indicated genotype were ip injected with a sublethal dose of 1×10⁷ cfus Ca. After 4–6 h, peritoneum was flushed and cell number was determined by CASY-counting. Analysis of Ly6G+ and Ly6C+ peritoneal cells from WT versus Ifnar1−/− mice (dot plot). (C) Kidney total RNA was analysed for gene expression of Ccl2. (D) KC concentrations in kidney supernatants were measured using a multiplex bead array system. Both (C) and (D) show the mean ± SEM of three independent experiments (n = 7–12 mice per group). (E) Kidney total RNA was analysed for gene expression of Il-1β. Data presented show the mean ± SEM of three independent experiments (n = 7–12 mice per group).
Figure 5
Figure 5. IFN-I signaling regulates Ly6Chi monocytes recruitment and activation.
(A) Expression of Ly6C and CD11c on GM-CSF-differentiated BM-DCs at day 8 of culture (dot plot). BM-DCs of the indicated genotypes were stimulated with heat-inactivated Ca. After 24 h, CCL2, CCL7, KC, and MIP-2 release was determined by ELISA or a multiplex bead array system. Data presented show the mean ± SEM of three independent experiments. (B–H) Mice of the indicated genotype were injected with a lethal dose of 1×10⁵ cfus Ca. At indicated time points, blood, BM and kidneys were collected. (B) Ca cfus in BM were determined and expressed as cfus/mouse bones (n = 3–5 mice per group). Each symbol represents one mouse; horizontal bars indicate the calculated median. (C) BM from day 1-infected mice was isolated and placed in culture. At indicated time points, CCL2 release into the media was measured (n = 3 mice per group). (D) Expression of Ly6C and CD11b on blood leukocytes at day 5 of Ca infection in WT versus Ifnar1−/− mice. Inflammatory monocytes were gated in R1. (E) Quantification of cells in the R1 gate at different time points post infection. Depicted are percent inflammatory monocytes of total WBCs (left) and absolute cell numbers in ×107/l blood (right). (n = 3–5 mice per group) (F–G) Kidney leukocytes were enriched and characterized by multi-label flow cytometry. (F) Expression of Ly6C and CD11b on kidney leukocytes at day 1 of Ca infection. Inflammatory monocytes are gated in R2 (dot plot). Expression of the inflammatory DC surface markers CCR2, CD11c, MHC II, and PDCA1 by cells in the R2 gate. Solid lines, staining of R2 cells of day 1-infected mice; shaded histograms, for CCR2: staining with isotype control antibody, for CD11c and MHCII: staining of CD11cMHCII neutrophils, for PDCA1: staining of R2 cells of uninfected mice. Data presented are representatives of three independent experimental repeats (total n = 11–14 mice per group). (G) Kidney leukocytes at day one of infection were stained intracellularly for iNOS. Graphs show iNOS+ cells (green) overlayed on total CD45+ leukocytes (black). Bar diagram shows the quantification of iNOS+ cells in percent of total CD11b+ cells. Data presented show the mean ± SEM of two independent experiments (n = 8–9 mice per group). (H) Kidney total RNA was analysed for gene expression of iNOS. Data presented show the mean ± SEM of three independent experiments (n = 7–12 mice per group).
Figure 6
Figure 6. Pioglitazone suppresses lethal inflammatory phagocyte activity.
WT mice were injected with a lethal dose of 1×10⁵ cfus Ca and treated daily with 5 mg/kg pioglitazone. (A) Survival and mean percentage of original body weight of drug-treated versus vehicle-treated mice are presented. Data presented show the sum of two independent experimental repeats (n = 13–16 mice per group). (B) Kidney leukocytes were enriched and absolute numbers of inflammatory monocytes and neutrophils determined. Each symbol represents one mouse; horizontal bars indicate the calculated median (n = 6 mice per group). (C) Kidney leukocytes at day 1 of infection were intracellularly stained for iNOS. Bar diagram shows the quantification of iNOS+ cells in percent of total CD11b+ cells, mean ± SEM (n = 6 mice per group). (D) Absolute numbers of neutrophils in kidneys of treated vs non-treated mice. Each symbol represents one mouse; horizontal bars indicate the calculated median (n = 4–5 mice per group). (E) Urea concentration in serum, mean ± SEM (n = 4–5 mice per group). (F) BM-DCs were pre-treated overnight with indicated concentrations of pioglitazone and stimulated with heat-inactivated Ca the next day. After 24 h of Ca co-incubation, CCL2, CCL7, and IFN-β release were measured by ELISA. Data presented show the mean ± SEM of 3 independent experiments.
Figure 7
Figure 7. IFNs-I regulate detrimental Ly6Chi monocyte and neutrophil activity.
Model of IFN-I-mediated monocyte/neutrophil recruitment and activation of inflammatory DC during invasive Ca infections. Ca recognition triggers an IFN response, which controls the production of various chemokines, including CCL2 and KC, at different anatomical body sites (BM and kidneys). In response to local CCL2 in the BM, Ly6Chi monocytes exit into the blood stream and migrate towards the target organ where they differentiate into inflammatory DCs. To fully functionally mature and become iNOS-producing cells, DCs require signaling through IFNAR1. The high presence and activity of inflammatory DCs and neutrophils in the kidney during the early infection phase promotes a secondary strong influx of neutrophils culminating in lethal immunopathology. The suppressive action of pioglitazone on Ly6Chi monocyte/neutrophil recruitment and function ameliorates hyper-inflammation and kidney pathology.

References

    1. Wisplinghoff H, Seifert H, Wenzel RP, Edmond MB. Inflammatory response and clinical course of adult patients with nosocomial bloodstream infections caused by Candida spp. Clin Microbiol Infect. 2006;12:170–177. - PubMed
    1. Borden EC, Sen GC, Uze G, Silverman RH, Ransohoff RM, et al. Interferons at age 50: past, current and future impact on biomedicine. Nat Rev Drug Discov. 2007;6:975–990. - PMC - PubMed
    1. Decker T, Muller M, Stockinger S. The yin and yang of type I interferon activity in bacterial infection. Nat Rev Immunol. 2005;5:675–687. - PubMed
    1. Bourgeois C, Majer O, Frohner IE, Lesiak-Markowicz I, Hildering KS, et al. Conventional dendritic cells mount a type I IFN response against Candida spp. requiring novel phagosomal TLR7-mediated IFN-beta signaling. J Immunol. 2011;186:3104–3112. - PubMed
    1. Biondo C, Signorino G, Costa A, Midiri A, Gerace E, et al. Recognition of yeast nucleic acids triggers a host-protective type I interferon response. Eur J Immunol. 2011;41:1969–1979. - PubMed

Publication types

MeSH terms