Ontogeny of the maize shoot apical meristem
- PMID: 22911570
- PMCID: PMC3462627
- DOI: 10.1105/tpc.112.099614
Ontogeny of the maize shoot apical meristem
Abstract
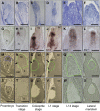
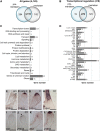
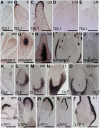
The maize (Zea mays) shoot apical meristem (SAM) arises early in embryogenesis and functions during stem cell maintenance and organogenesis to generate all the aboveground organs of the plant. Despite its integral role in maize shoot development, little is known about the molecular mechanisms of SAM initiation. Laser microdissection of apical domains from developing maize embryos and seedlings was combined with RNA sequencing for transcriptomic analyses of SAM ontogeny. Molecular markers of key events during maize embryogenesis are described, and comprehensive transcriptional data from six stages in maize shoot development are generated. Transcriptomic profiling before and after SAM initiation indicates that organogenesis precedes stem cell maintenance in maize; analyses of the first three lateral organs elaborated from maize embryos provides insight into their homology and to the identity of the single maize cotyledon. Compared with the newly initiated SAM, the mature SAM is enriched for transcripts that function in transcriptional regulation, hormonal signaling, and transport. Comparisons of shoot meristems initiating juvenile leaves, adult leaves, and husk leaves illustrate differences in phase-specific (juvenile versus adult) and meristem-specific (SAM versus lateral meristem) transcript accumulation during maize shoot development. This study provides insight into the molecular genetics of SAM initiation and function in maize.
Figures


Comment in
-
Transcriptome study outlines ontogeny of the maize shoot apical meristem.Plant Cell. 2012 Aug;24(8):3169. doi: 10.1105/tpc.112.240812. Epub 2012 Aug 28. Plant Cell. 2012. PMID: 22932673 Free PMC article. No abstract available.
Similar articles
-
Microdissection of shoot meristem functional domains.PLoS Genet. 2009 May;5(5):e1000476. doi: 10.1371/journal.pgen.1000476. Epub 2009 May 8. PLoS Genet. 2009. PMID: 19424435 Free PMC article.
-
Laser microdissection of narrow sheath mutant maize uncovers novel gene expression in the shoot apical meristem.PLoS Genet. 2007 Jun;3(6):e101. doi: 10.1371/journal.pgen.0030101. Epub 2007 May 7. PLoS Genet. 2007. PMID: 17571927 Free PMC article.
-
The dynamics of soybean leaf and shoot apical meristem transcriptome undergoing floral initiation process.PLoS One. 2013 Jun 6;8(6):e65319. doi: 10.1371/journal.pone.0065319. Print 2013. PLoS One. 2013. PMID: 23762343 Free PMC article.
-
Cell signaling in the shoot apical meristem.Plant Physiol. 2023 Aug 31;193(1):70-82. doi: 10.1093/plphys/kiad309. Plant Physiol. 2023. PMID: 37224874 Review.
-
The Shoot Apical Meristem: An Evolutionary Molding of Higher Plants.Int J Mol Sci. 2024 Jan 26;25(3):1519. doi: 10.3390/ijms25031519. Int J Mol Sci. 2024. PMID: 38338798 Free PMC article. Review.
Cited by
-
Amino Acid and Secondary Metabolite Production in Embryogenic and Non-Embryogenic Callus of Fingerroot Ginger (Boesenbergia rotunda).PLoS One. 2016 Jun 3;11(6):e0156714. doi: 10.1371/journal.pone.0156714. eCollection 2016. PLoS One. 2016. PMID: 27258536 Free PMC article.
-
Catalyzing plant science research with RNA-seq.Front Plant Sci. 2013 Apr 1;4:66. doi: 10.3389/fpls.2013.00066. eCollection 2013. Front Plant Sci. 2013. PMID: 23554602 Free PMC article.
-
The comparative gene expression concern to the seed pigmentation in maize (Zea mays L.).Genomics Inform. 2020 Sep;18(3):e29. doi: 10.5808/GI.2020.18.3.e29. Epub 2020 Sep 9. Genomics Inform. 2020. PMID: 33017873 Free PMC article.
-
The Evolution of an Invasive Plant, Sorghum halepense L. ('Johnsongrass').Front Genet. 2020 May 14;11:317. doi: 10.3389/fgene.2020.00317. eCollection 2020. Front Genet. 2020. PMID: 32477397 Free PMC article.
-
Genome-wide analysis of spatiotemporal expression patterns during rice leaf development.BMC Genomics. 2021 Mar 9;22(1):169. doi: 10.1186/s12864-021-07494-5. BMC Genomics. 2021. PMID: 33750294 Free PMC article.
References
-
- Abbe E.C., Stein O.L. (1954). The growth of the shoot apex in maize: Embryogeny. Am. J. Bot. 41: 285–293
-
- Abedon B.G., Hatfield R.D., Tracy W.F. (2006). Cell wall composition in juvenile and adult leaves of maize (Zea mays L.). J. Agric. Food Chem. 54: 3896–3900 - PubMed
-
- Aida M., Ishida T., Tasaka M. (1999). Shoot apical meristem and cotyledon formation during Arabidopsis embryogenesis: Interaction among the CUP-SHAPED COTYLEDON and SHOOT MERISTEMLESS genes. Development 126: 1563–1570 - PubMed
-
- Boyd L. (1931). Evolution in the monocotyledonous seedling, a new interpretation of the grass embryo. Trans. Bot. Soc. Edinburgh 30: 286–302
Publication types
MeSH terms
Substances
LinkOut - more resources
Full Text Sources
Other Literature Sources

