. 2012;8(7):e1002840.
doi: 10.1371/journal.pgen.1002840. Epub 2012 Jul 26.

Pregnancy-induced noncoding RNA (PINC) associates with polycomb repressive complex 2 and regulates mammary epithelial differentiation

Affiliations

Pregnancy-induced noncoding RNA (PINC) associates with polycomb repressive complex 2 and regulates mammary epithelial differentiation

Amy N Shore et al. PLoS Genet. 2012.

Abstract

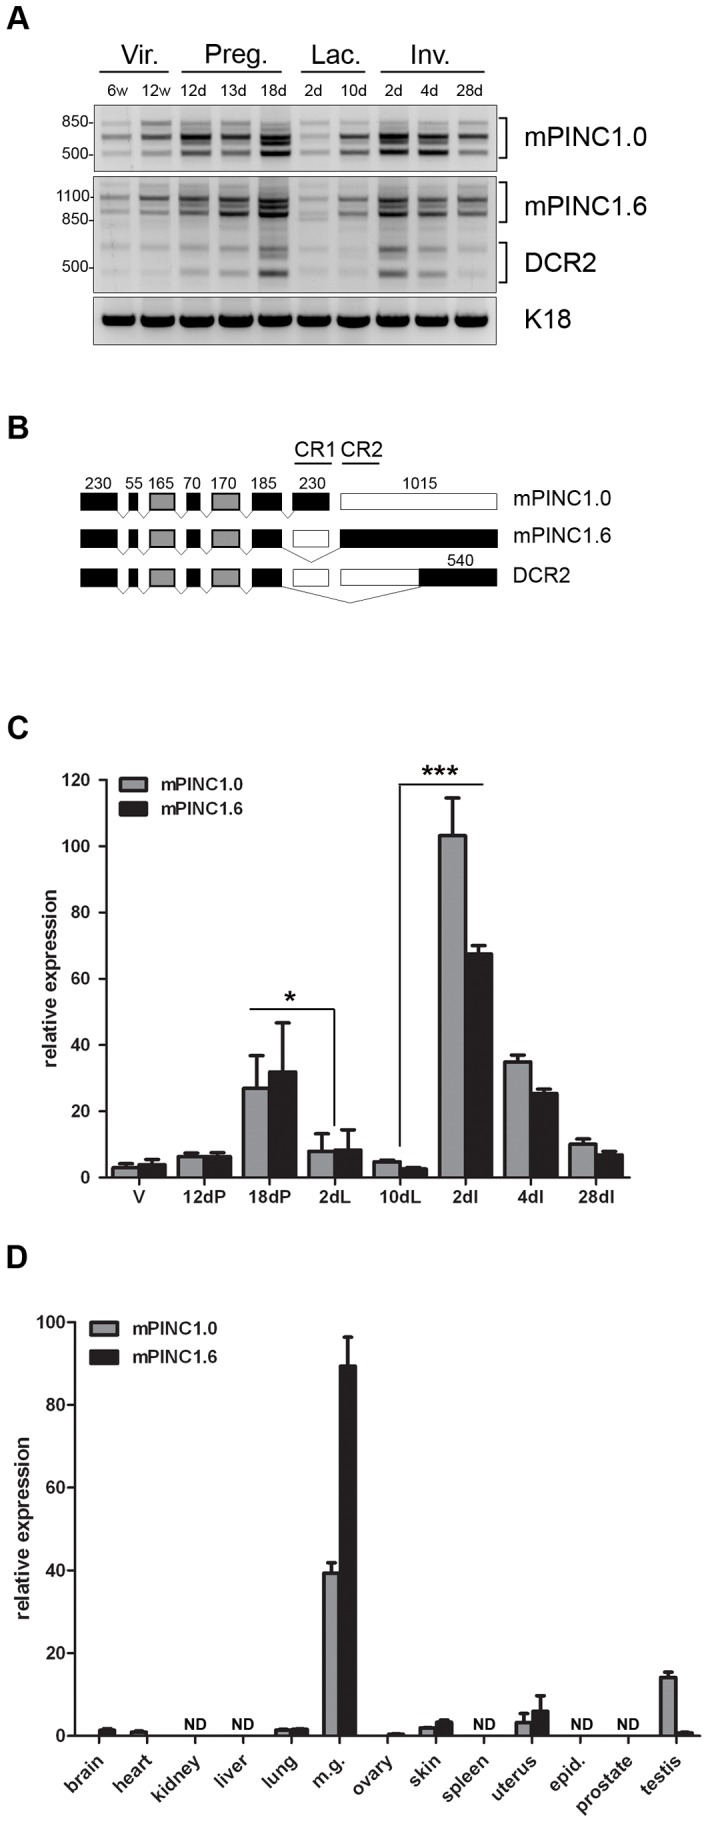
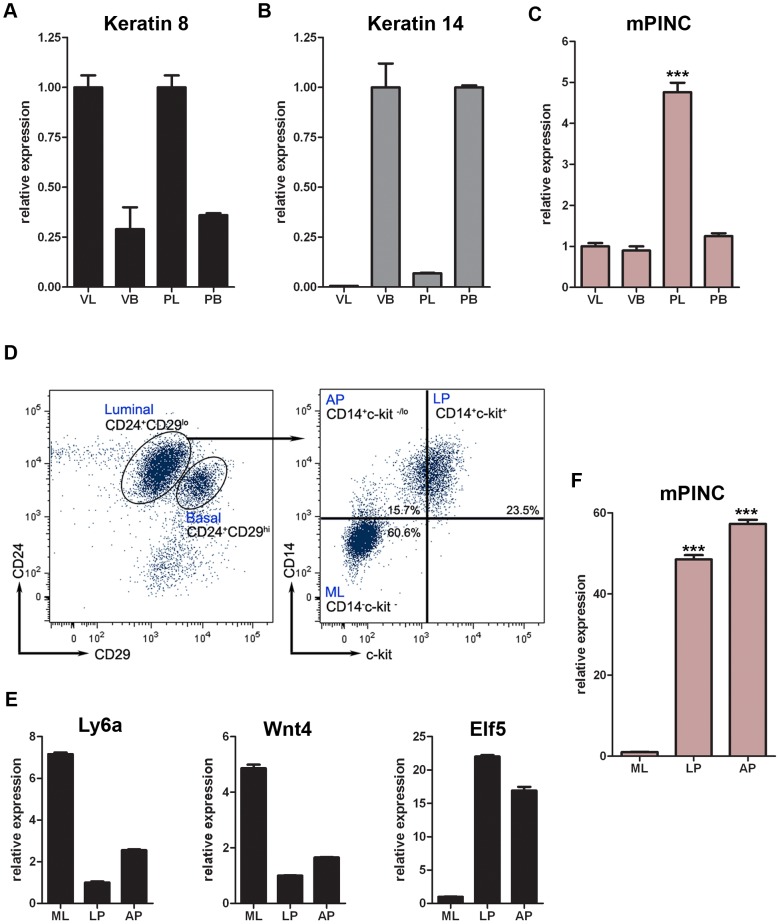
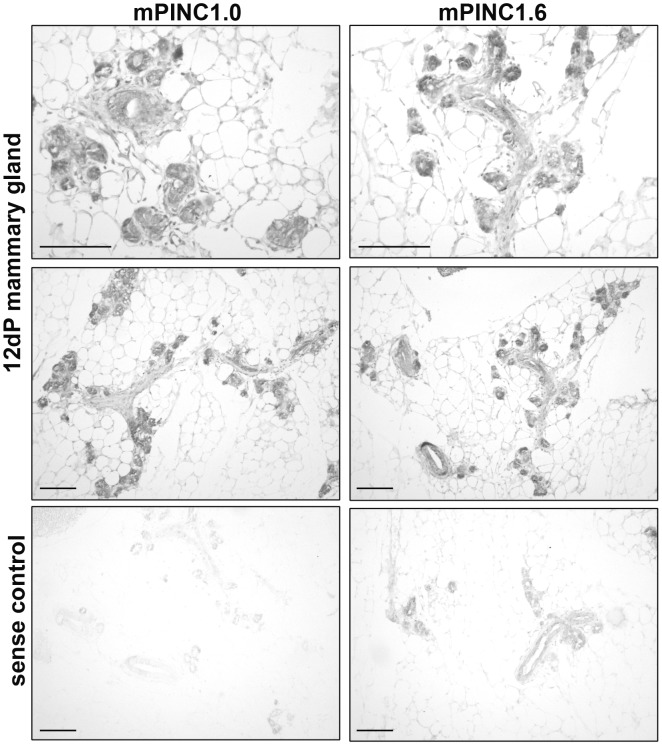
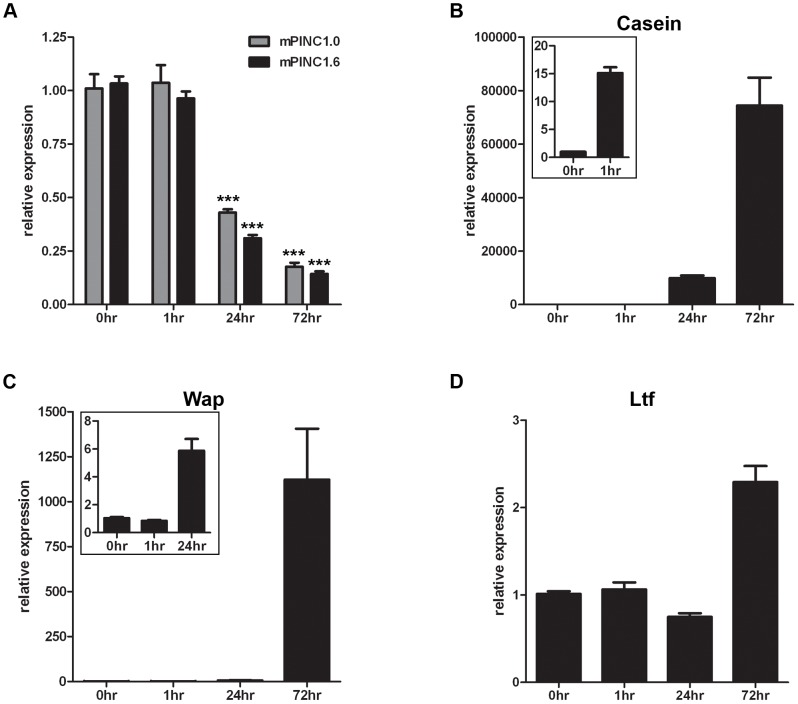
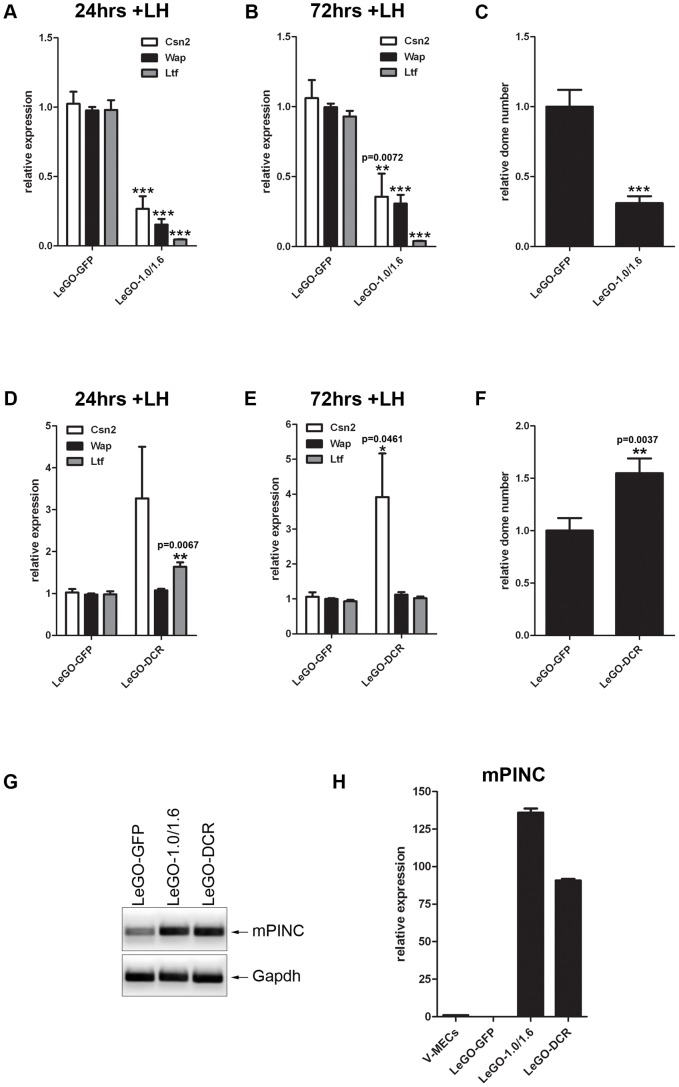
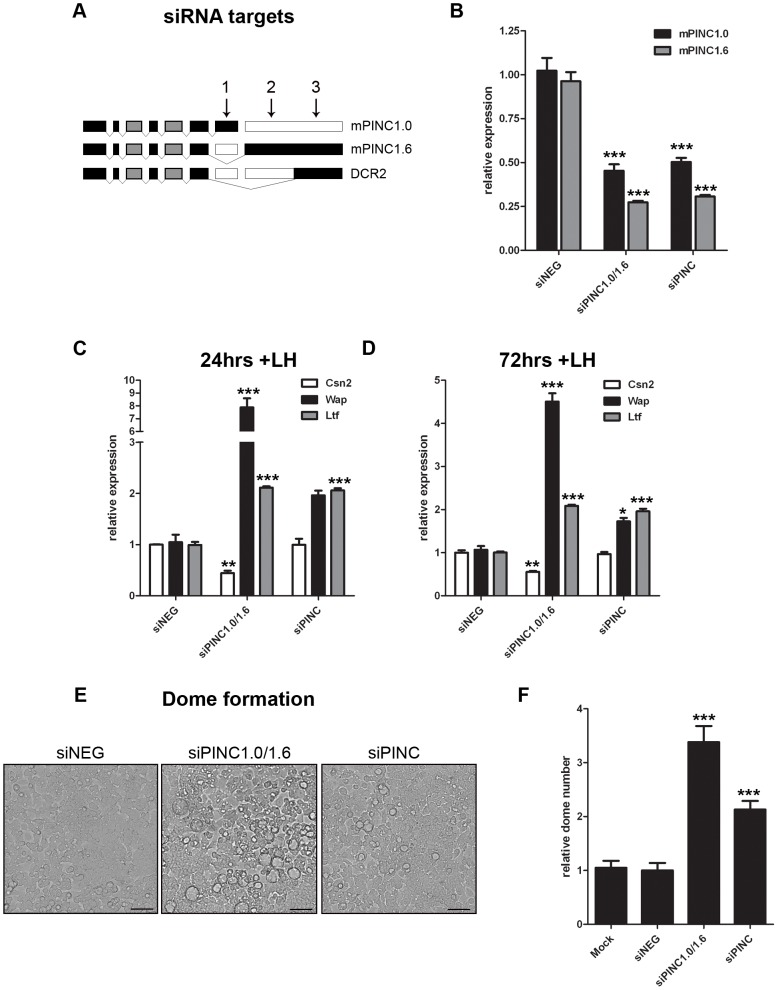
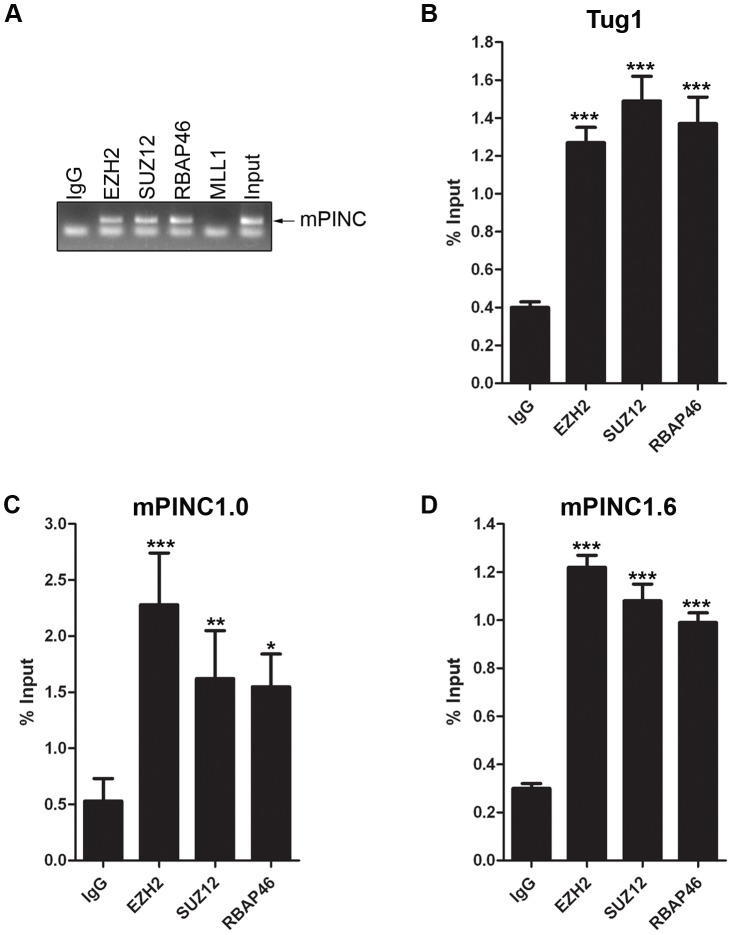
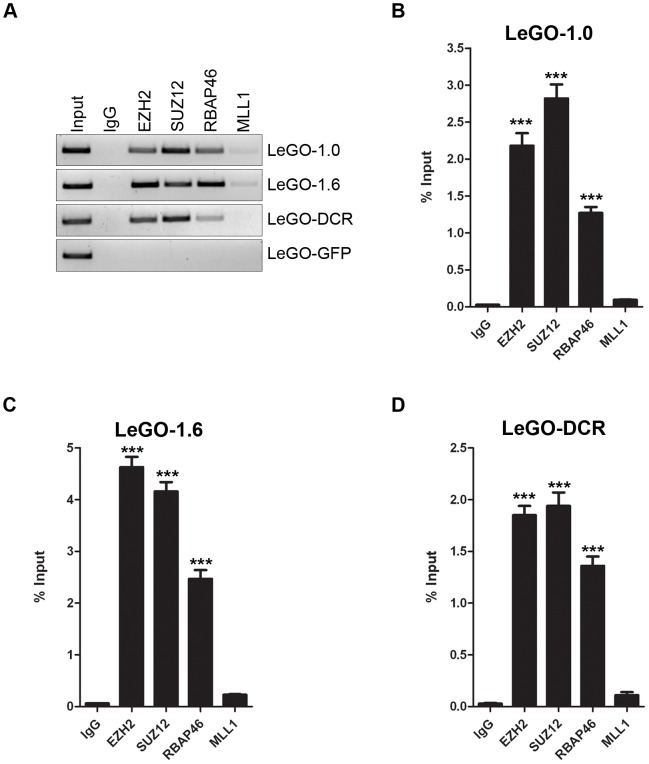
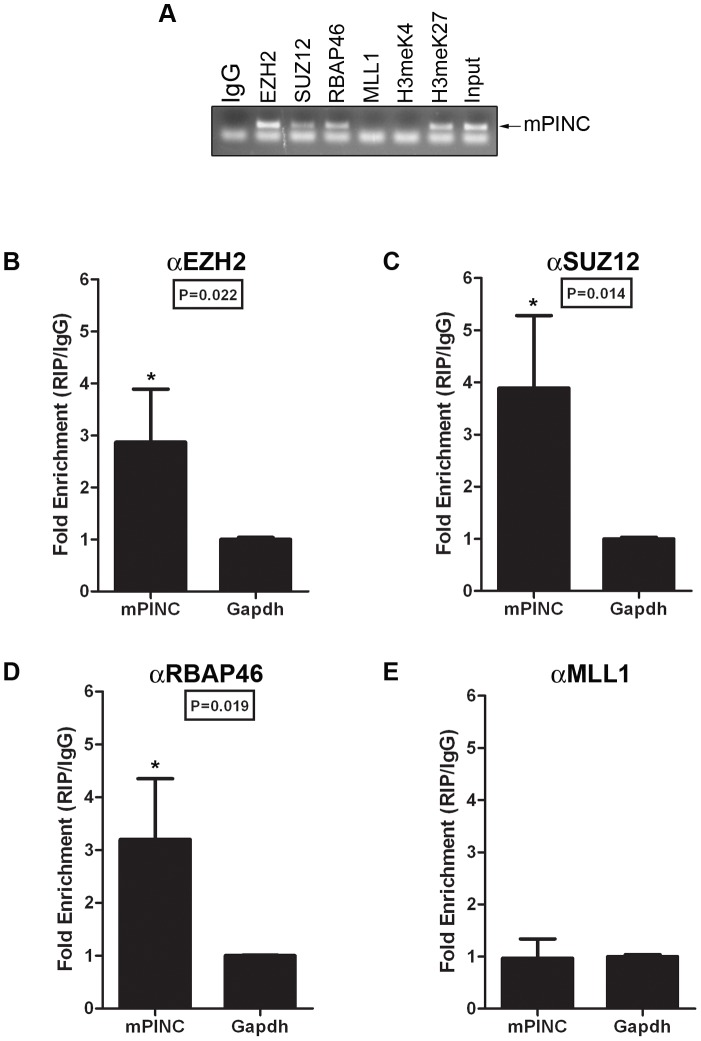
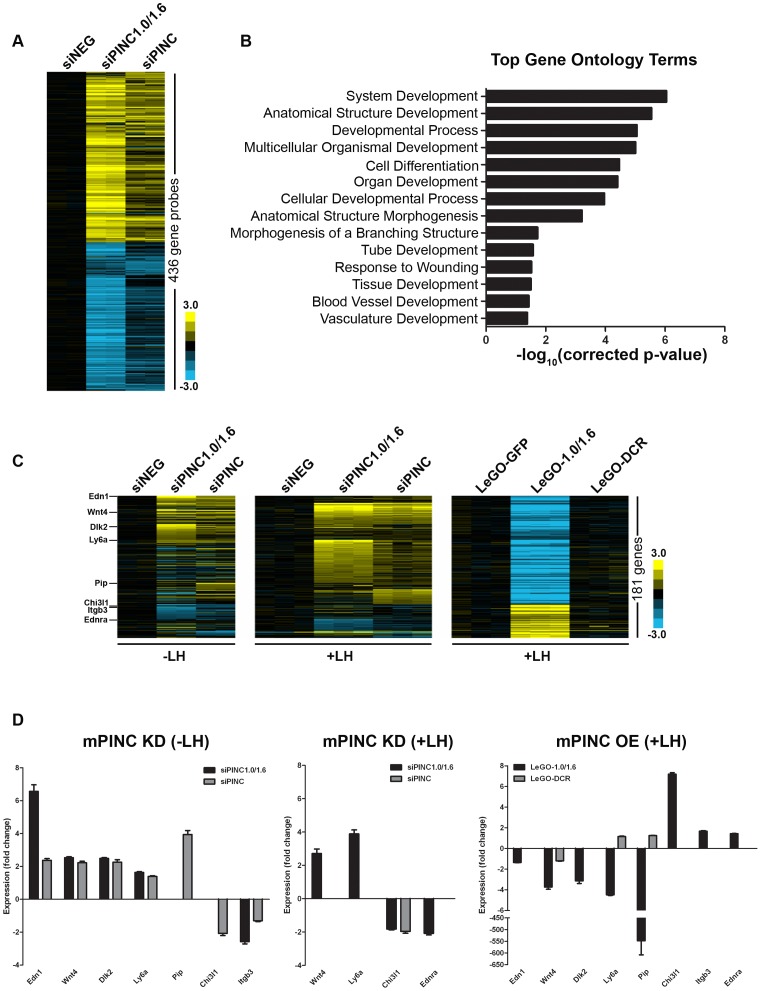
Pregnancy-induced noncoding RNA (PINC) and retinoblastoma-associated protein 46 (RbAp46) are upregulated in alveolar cells of the mammary gland during pregnancy and persist in alveolar cells that remain in the regressed lobules following involution. The cells that survive involution are thought to function as alveolar progenitor cells that rapidly differentiate into milk-producing cells in subsequent pregnancies, but it is unknown whether PINC and RbAp46 are involved in maintaining this progenitor population. Here, we show that, in the post-pubertal mouse mammary gland, mPINC is enriched in luminal and alveolar progenitors. mPINC levels increase throughout pregnancy and then decline in early lactation, when alveolar cells undergo terminal differentiation. Accordingly, mPINC expression is significantly decreased when HC11 mammary epithelial cells are induced to differentiate and produce milk proteins. This reduction in mPINC levels may be necessary for lactation, as overexpression of mPINC in HC11 cells blocks lactogenic differentiation, while knockdown of mPINC enhances differentiation. Finally, we demonstrate that mPINC interacts with RbAp46, as well as other members of the polycomb repressive complex 2 (PRC2), and identify potential targets of mPINC that are differentially expressed following modulation of mPINC expression levels. Taken together, our data suggest that mPINC inhibits terminal differentiation of alveolar cells during pregnancy to prevent abundant milk production and secretion until parturition. Additionally, a PRC2 complex that includes mPINC and RbAp46 may confer epigenetic modifications that maintain a population of mammary epithelial cells committed to the alveolar fate in the involuted gland.


Conflict of interest statement

The authors have declared that no competing interests exist.

Figures

Figure 1
Figure 1. mPINC expression peaks in the late pregnant and early involuting gland.
(A) RT-PCR shows multiple splice forms of mPINC1.0 and mPINC1.6 are expressed during mammary gland development. Primers designed to the extreme ends of mPINC1.0 and mPINC1.6 were used to amplify cDNA from mammary gland developmental stages. (w Vir.: weeks old virgin, d Preg.: days pregnancy, d Lac.: days lactation, d Inv.: days involution). PCR products were sequenced and found to be new splice forms of mPINC, including a new splice variant of mPINC1.6 called DCR2, for deleted conserved region 2. (B) Schematic diagram of mPINC exonic structure. Black boxes represent exons that are always included, grey boxes are sometimes included and clear boxes are never included. Nucleotide length is indicated above each exon along with black lines that overlap the most conserved regions of the PINC locus, CR1 and CR2. Exon 6 sometimes has an additional 24 nucleotides at the 3′ end in the mPINC1.0 and mPINC1.6 splice forms. This alternative splice site does not correlate with the inclusion/exclusion of any particular exon and its function is unknown. (C) qPCR shows mPINC is highest during late pregnancy and early involution. Mammary glands were harvested from 3 female Balb/c mice for each stage (V: adult virgin, dP: days pregnant, dL: days lactation, dI: days involution). Target genes were normalized to Actb and set relative to levels in the virgin mammary gland. (D) mPINC expression is most abundant in the mammary gland. Tissues were harvested from three 10 week old virgin Balb/c female mice and testis, epididymis, and prostate was harvested from three 12 week old male Balb/c mice. ND indicates tissues in which mPINC was not detected by qPCR. Target genes were normalized to Actb and set relative to levels in the lung.
Figure 2
Figure 2. mPINC rises specifically in the luminal compartment during pregnancy and is enriched in luminal and alveolar progenitors of the mammary gland.
(A–C) RNA was isolated from FACs sorted mammary populations including, virgin luminal (VL) and basal (VB) as well as pregnant luminal (PL) and basal (PB). (A) qPCR showed Krt8 expression was enriched in the luminal populations (VL and PL), (B) Krt14 was enriched in the basal populations (VB and PB) and (C) mPINC was enriched in the pregnant luminal population, (D–F) MECs were FACs sorted into luminal and basal populations using CD24 and CD29. The luminal population was selected and further sorted into mature luminal (ML), luminal progenitors (LP), and alveolar progenitors (AP) using CD14 and ckit. (D) FACs dot plots showing CD24 and CD29 (left panel) as well as CD14 and ckit (right panel) from virgin MECs. (E) qPCR showed Ly6a and Wnt4 enriched in the ML population and Elf5 in the LP population thus verifying the purity of each population. (F) mPINC was enriched in the luminal progenitors and alveolar progenitors. Data represent mean ±SD (n = 3). Target genes were normalized to Gapdh.
Figure 3
Figure 3. mPINC is enriched in alveolar cells of the pregnant gland.
In situ hybridization using DIG-labeled probes shows mPINC1.0 and mPINC1.6 are expressed in alveolar cells of the 12 day mouse mammary gland. Sense control probes for mPINC1.0 and mPINC1.6 show very little signal in the bottom panels. Scale bars represent 100 µm.
Figure 4
Figure 4. mPINC expression declines during lactogenic hormone induced differentiation of HC11 cells.
(A–C) Confluent HC11 cells were treated with lactogenic hormones for 1, 24 and 72 hrs followed by RNA isolation to detect changes in gene expression. Target genes were normalized to Gapdh and set relative to levels in untreated HC11 cells. Data are presented as mean ± SEM (n = 3). (A) qPCR shows mPINC1.0 and mPINC1.6 expression decreases following 24 and 72 hrs of hormone treatment. (B) qPCR shows Csn2 levels begin to rise after 1 hr of hormone treatment and continue to rise at 24 and 72 hrs. (C) qPCR shows Wap expression levels rise following 24 hrs of hormone treatment and continue to rise after 72 hrs. (D) Ltf expression levels rise following 72 hrs of lactogenic hormone treatment.
Figure 5
Figure 5. Overexpression of mPINC inhibits differentiation of HC11 cells.
(A–C) After 24 (A) and 72 (B) hrs of hormone induction, LeGO-1.0/1.6 cells show reduced levels of Csn2, Wap, and Ltf expression by qPCR. Target genes were normalized to Gapdh and set relative to LeGO-GFP levels. Data are presented as mean ± SEM (n = 6). (C) Overexpression of mPINC also reduces formation of domes. Domes were counted at 48 hrs post-hormone treatment from nine 20× fields/experiment and data represent mean ± SEM set relative to the dome number in the LeGO-GFP control group (n = 6). (D–F) After 24 (D) and 72 (E) hrs of hormone induction, LeGO-DCR cells show increased levels of Ltf (at 24 hrs) and Csn2, but not Wap, expression compared to LeGO-GFP cells. Target genes were normalized to Gapdh and set relative to LeGO-GFP levels. Data are presented as mean ± SEM (n = 6). (F) Overexpression of the DCR mutant enhances dome formation compared to the control. Experiment was performed and analyzed as described in panel C. (G) RT-PCR shows mPINC overexpressed transcript in LeGO-1.0/1.6 and LeGO-DCR HC11 cells compared to endogenous levels in LeGO-GFP cells. (H) qPCR shows mPINC overexpressed levels are high and fairly equivalent relative to mPINC endogenous levels in MECs purified from virgin mammary gland (V-MECs). Target gene was normalized to Gapdh. Data are presented as mean ± SEM for three independent experiments.
Figure 6
Figure 6. Knockdown of mPINC enhances differentiation of HC11 cells.
(A, B) To target mPINC1.0 and mPINC1.6 (siPINC1.0/1.6), but not DCR2, siRNAs #1 and #2 were used in combination. To target all splice variants (siPINC), siRNAs #1 and #3 were used in combination. (A) Schematic showing siRNA targets of mPINC splice forms. (B) qPCR shows knockdown of mPINC 5 days post-transfection of siRNAs. Target genes were normalized to Gapdh and set relative to levels in the siNEG control transfected HC11 cells. (C, D) Knockdown of mPNC (siPINC1.0/1.6 and siPINC) splice forms increases Wap and Ltf, but not Csn2, expression at 24 (C) and 72 (D) hrs post-hormone induction. Target genes were normalized to Gapdh and set relative to levels in siNEG treated control cells. Data are presented as mean ± SEM (n = 3). (E, F) Knockdown of mPINC also increases dome formation compared to a control. (E) Representative brightfield images show domes following 48 hrs of hormone treatment. Scale bars represent 50 µm. (F) Domes were counted at 48 hours post-hormone treatment from nine 20× fields/experiment and data represent mean ± SEM set relative to the dome number in the siNEG treated control group (n = 6).
Figure 7
Figure 7. mPINC interacts with PRC2 in HC11 cells.
(A–D) RIP assays were performed with HC11 cells using antibodies to PRC2 members including, EZH2, SUZ12 and RbAp46. An MLL1 antibody was used as a negative control and an lncRNA known to interact with PRC2, Tug1, was used as a positive control. RNA was isolated from pull downs to detect associated RNAs. (A) RT-PCR shows mPINC is associated with PRC2 members, but not MLL1. (B–D) qPCR shows the amount of Tug1 (B), mPINC1.0 (C) and mPINC1.6 (D) transcript associated with each protein as a percentage of input RNA levels. Data represent mean ± SD (n = 3).
Figure 8
Figure 8. Overexpressed mPINC transcripts interact with PRC2 in HC11 cells.
(A–D) RIP assays were performed with mPINC overexpressing HC11 cell using antibodies to PRC2 members including, EZH2, SUZ12 and RbAp46. An MLL1 antibody was used as a negative control. (A) RT-PCR shows that overexpressed mPINC1.0, mPINC1.6 and the DCR mutant interact with PRC2 members, but not IgG or MLL1. (B–D) qPCR shows the amount of mPINC1.0 (B), mPINC1.6 (C) and DCR (D) transcript associated with each protein as a percentage of input RNA levels. Data represent mean ± SD (n = 3).
Figure 9
Figure 9. mPINC associates with PRC2 in the 16-day pregnant mammary gland.
(A–D) RIP assays were performed with MECs purified from mammary glands at day 16 of pregnancy using antibodies to PRC2 members and its associated histone modification, H3meK27. Antibodies to MLL1 and its associated histone modification, H3meK4, were also used as negative controls. (A) RT-PCR shows mPINC is associated with PRC2 members and H3meK27. mPINC does not associate with MLL1 or H3meK4. (B–D) qPCR shows fold enrichment of mPINC transcript levels associated with EZH2 (B), SUZ12 (C) RpAp46 (D) and MLL1 (E) relative to Gapdh levels. Data represent mean ± SD (n = 3).
Figure 10
Figure 10. Microarray identifies potential targets of mPINC in HC11 cells.
(A) Heat map showing transcript profiling of biological replicates of control siNEG cells, siPINC1.0/1.6, and siPINC 5 days post-siRNA transfection ( p<0.01 and fold change >1.8 in either siPINC1.0/1.6 or siPINC relative to siNEG). (B) Graph indicating the most significantly enriched gene ontology terms in the mPINC knockdown data set. (C) Three heat map panels depicting genes that are differentially expressed between either undifferentiated (−LH) mPINC knockdown cells (left panel) or differentiated (+LH) mPINC knockdown cells (middle panel) and differentiated (+LH) mPINC overexpression cells (right panel). 181 genes were found to be differentially regulated by mPINC (141 genes are upregulated by knockdown and downregulated by overexpression, while 40 genes are downregulated by knockdown and upregulated by overexpression at a p<0.01 and fold change >1.4, both for the overexpression and either knockdown group in the opposite direction). Genes whose expression was validated by qPCR are indicated in the heat map on the left. (D) qPCR verified differential expression of genes in mPINC knockdown (KD) compared to overexpression (OE) cells. qPCR was performed on biological triplicates, normalized using Gapdh, and shown as fold change compared to the negative control (either siNEG or LeGO-GFP).
Figure 11
Figure 11. Structural analysis of the PINC locus.
(A) Genomic representation of the PINC locus showing alternate isoforms mPINC1.0, mPINC1.6 and DCR2. Regions of evolutionarily conserved RNA structures were predicted by SISSIz (see Methods). (B–D) Circle plot secondary structure representations of interacting nucleotides in mPINC1.0 (B), mPINC1.6 (C) and DCR2 (D). The probability of the interactions is color-coded according to the legend (right). Secondary structures were computed using the RNAstructure software (see Methods). (E–F) High-confidence localized hairpin structures that represent possible protein-interaction sites and their most stable 3D representations, as modelled by MC-FOLD/MC-SYM. The corresponding regions in B–D are indicated by S1, for structure 1 (E) and by S2, for structure 2 (F) grey arcs.

Similar articles

Cited by

References

    1. Wapinski O, Chang HY. Long noncoding RNAs and human disease. Trends Cell Biol. 2011;21:354–361. - PubMed
    1. Huarte M, Rinn JL. Large non-coding RNAs: missing links in cancer? Hum Mol Genet. 2010;19:R152–161. - PMC - PubMed
    1. Khalil AM, Rinn JL. RNA-protein interactions in human health and disease. Semin Cell Dev Biol. 2011;22:359–365. - PMC - PubMed
    1. Pauli A, Rinn JL, Schier AF. Non-coding RNAs as regulators of embryogenesis. Nat Rev Genet. 2011;12:136–149. - PMC - PubMed
    1. Prasanth KV, Spector DL. Eukaryotic regulatory RNAs: an answer to the ‘genome complexity’ conundrum. Genes Dev. 2007;21:11–42. - PubMed

Publication types

Associated data