. 2012 Sep 5;104(17):1320-34.
doi: 10.1093/jnci/djs336. Epub 2012 Aug 21.

Targeting carcinoma-associated fibroblasts within the tumor stroma with a fibroblast activation protein-activated prodrug

Affiliations

Targeting carcinoma-associated fibroblasts within the tumor stroma with a fibroblast activation protein-activated prodrug

W Nathaniel Brennen et al. J Natl Cancer Inst. .

Abstract

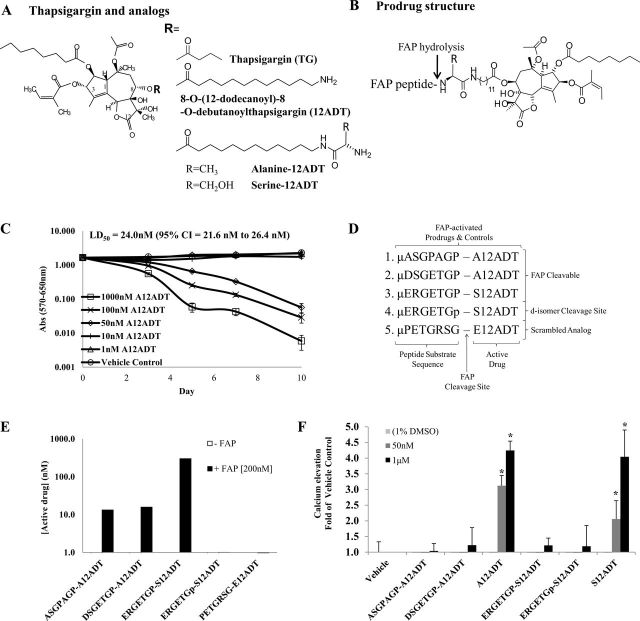
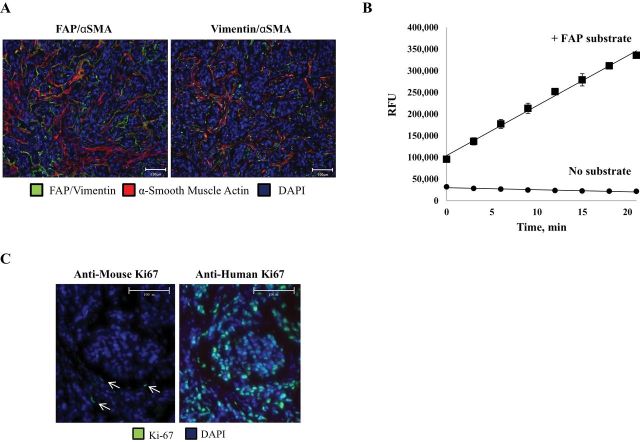
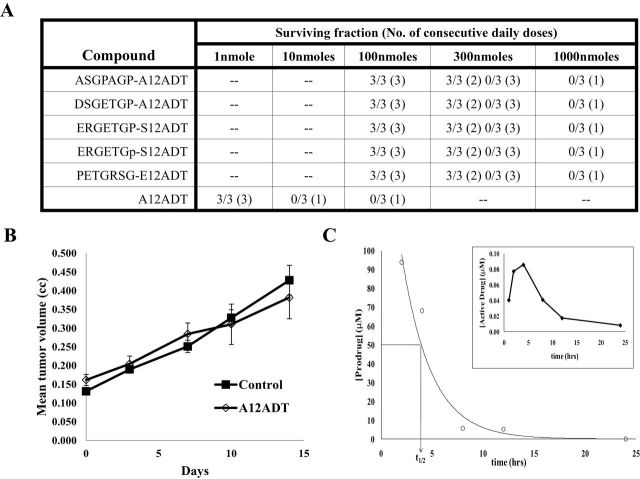
Background: Fibroblasts undergo a morphological transformation to a reactive phenotype in the tumor microenvironment characterized by the expression of proteins such as fibroblast activation protein (FAP), a post-prolyl endopeptidase with expression largely restricted to carcinoma-associated fibroblasts. Thapsigargin (TG) is a highly toxic natural plant product that triggers a rise in intracellular calcium levels and apoptosis. FAP is therefore a provocative target for the activation of prodrugs consisting of a FAP-specific peptide coupled to a potent cytotoxic analog of TG.

Methods: The efficacy of FAP-activated peptidyl-TG prodrugs was tested in vitro in cell proliferation assays and effects on intracellular calcium in human cancer cell lines. The effects of FAP-activated prodrugs on tumor growth and host toxicity were tested in Balb-C nude MCF-7 and LNCaP xenograft mice (n = 9-11 per group). P values were calculated using permutation tests based on 50 000 permutations. Mixed effects models were used to account for correlations among replicate measures. All statistical tests were two-sided.

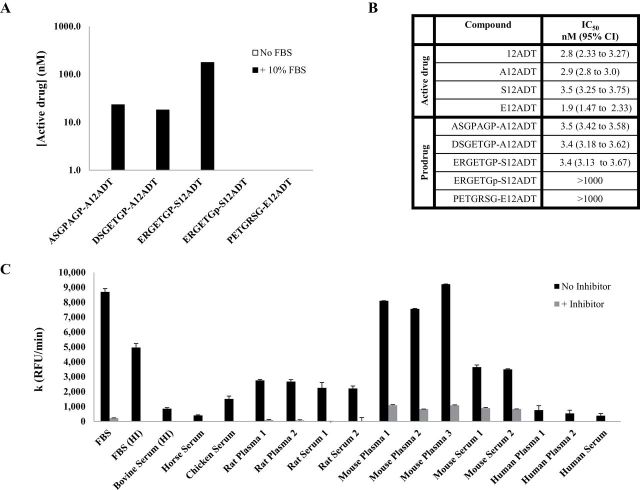
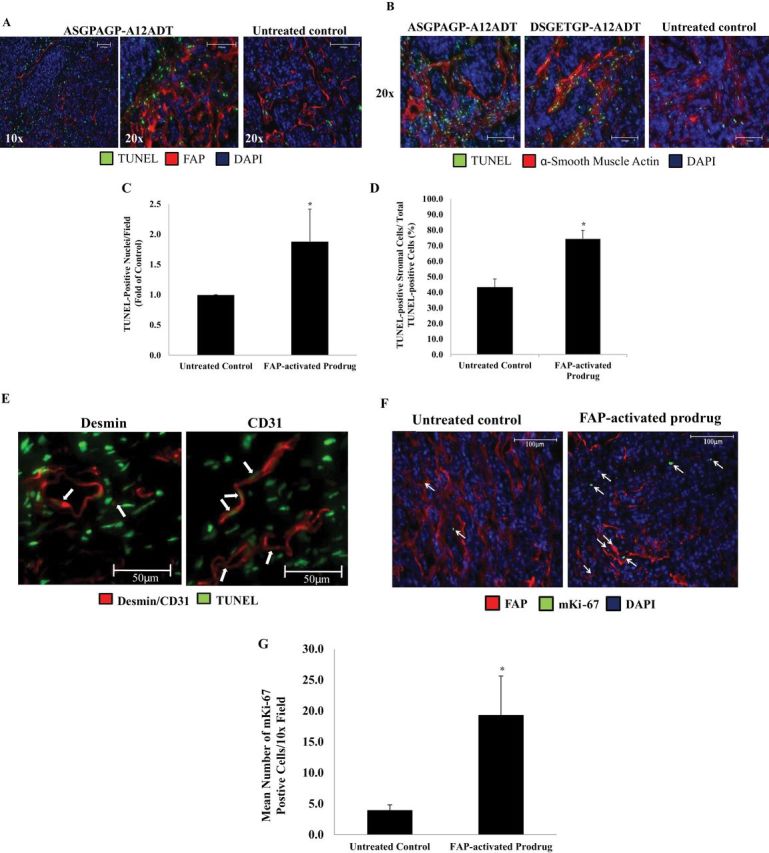
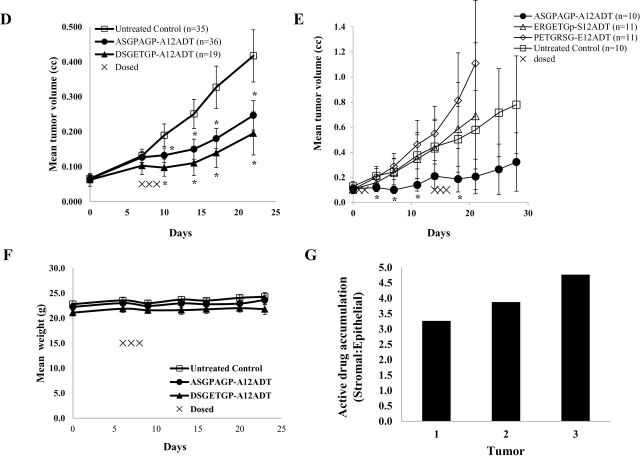
Results: FAP-activated prodrugs killed human cancer cells at low nanomolar concentrations (MCF-7 cells: IC(50) = 3.5 nM). Amino acid-12ADT analogs from FAP-cleaved prodrugs, but not uncleaved prodrugs, produced a rapid rise in intracellular calcium within minutes of exposure. Immunohistochemical analysis of xenografts exposed to FAP-prodrugs documented stromal-selective cell death of fibroblasts, pericytes, and endothelial cells of sufficient magnitude to inhibit growth of MCF-7 and LNCaP xenografts with minimal systemic toxicity, whereas non-FAP cleavable prodrugs were inactive. MCF-7 and LNCaP xenografts treated with a FAP-activated prodrug had maximal treated-to-control tumor volume ratios of 0.36 (treated: mean = 0.206 mm(3), 95% CI = 0.068 to 0.344 mm(3); control: mean = 0.580 mm(3), 95% CI = 0.267 to 0.893 mm(3)) and 0.24 (treated: mean = 0.131 mm(3), 95% CI = 0.09 to 0.180 mm(3); control: mean = 0.543 mm(3), 95% CI = 0.173 to 0.913 mm(3)), respectively, on day 21 after therapy.

Conclusions: This study validates the proteolytic activity of FAP as a target for the activation of a systemically delivered cytotoxic prodrug and demonstrates that targeted killing of cells within the stromal compartment of the tumor microenvironment can produce a therapeutic response.


Figures

Figure 1.
Figure 1.
Design and in vitro characterization of FAP-activated prodrugs. A) Structure of the potent natural plant product thapsigargin (TG) and its analogs, which are used as the cytotoxic “warhead” in FAP-activated prodrugs. B) Diagram of FAP-activated prodrug structure. Prodrugs consist of a peptide carrier containing a FAP-selective cleavage site coupled to a TG analog via a linker. C) The A12ADT amino acid-containing TG analog is as toxic against quiescent, nonproliferating fibroblasts as it is against those in the exponential growth phase. Results are the means of one independent experiment with seven replicates. Statistically significant P < .05, determined using permutation tests in a mixed effects model. D) Design of FAP-activated prodrugs and controls. Peptide sequences are based upon the substrate specificity of FAP as determined from a human collagen I-derived gelatin cleavage map (17) and were coupled to a thapsigargin analog, 8-O-(12-aminododecanoyl)-8-O-debutanoyl thapsigargin (12ADT). Two prodrug analog controls were also designed based on our lead sequence, one with the P1-Pro in the cleavage position converted to a d-isomer (represented by a “p”) and one with the amino acid sequence scrambled. E) FAP enzymatic activity can hydrolyze the FAP-activated prodrugs in vitro, but not the d-isomer and scrambled analog controls. F) The TSU human bladder cancer cell line was treated with increasing concentrations of the prodrugs or the active drug, and the effect on intracellular [Ca2+] was measured using the Fura-2, AM cell-permeable dye. The S- and A12ADT TG analogs (ie, the active forms of the prodrug) are able to induce a rapid rise in [Ca2+] at concentrations of 50nM, whereas the full-length inactive prodrugs do not cause this rise in cytosolic [Ca2+] even at concentrations 20-fold higher, 1 µM. Fifty nanomolar concentration only shown for active forms of the prodrug. Error bars represent 95% CI. Results are the means of three to six replicates per concentration per compound. Asterisks indicate statistically significant P < .05, determined using permutation test to compare means. (Note: mean of the replicates was used in the analysis.) TG = thapsigargin; FAP = fibroblast activation protein α; LD50 = lethal dose, 50%; CI = confidence interval.
Figure 2.
Figure 2.
In vitro activity of FAP-activated prodrugs. A) Hydrolysis of FAP-activated prodrugs in tissue culture media supplemented with 10% FBS but not in its absence. Non-FAP cleavable prodrug analogs are stable in FBS-supplemented media. B) Effect of FAP prodrugs on the growth of the MCF-7 human breast cancer cell line in vitro. Mean absorbance was calculated from a single experiment with seven replicates/concentration and reported with 95% confidence intervals (CI). C) Comparison of FAP enzymatic activity in the plasma/serum from multiple species based upon the rate of hydrolysis of a FAP-selective fluorescent substrate (MCa-ASGPAGPA-Dnp, 20 μM). The mouse had as much as 10-fold greater FAP activity in the plasma than did the human. The FAP-selective dipeptide boronic acid inhibitor, AcGbP, was used at a concentration of 200 μM. Error bars represent 95% CI. IC50 = half maximal inhibitory concentration; FBS = fetal bovine serum; CI = confidence interval; FAP = fibroblast activation protein α; RFU = relative fluorescence units.
Figure 3.
Figure 3.
The murine stroma and human cancer xenografts as a model to evaluate FAP-activated prodrugs. A) Fibroblasts infiltrating MCF-7 xenografts take on a reactive phenotype as characterized by the coexpression of FAP (left panel) or vimentin (right panel) (green) and α-smooth muscle actin (red). Images are representative and were taken at ×20 magnification. Scale bars = 100 μm. B) Presence of FAP enzymatic activity in MCF-7 tumor homogenates as indicated by the hydrolysis of a FAP-selective fluorescence-quenched peptide substrate (MCa-DRGETGPA-Dnp [1 µM]). Error bars represent 95% CI. C) Mouse stromal cells have a substantially lower proliferative index (arrows, left panel) than do the malignant epithelial cells (right panel) within the xenograft. Tumor sections were stained using an anti-mouse (left panel) or anti-human (right panel) Ki-67-specific antibody (green). The nuclei are counterstained with DAPI (blue). Image is representative and was taken at ×20 magnification. Scale bars = 100 μm. FAP = fibroblast activation protein α; RFU = relative fluorescence units; SMA = smooth muscle actin; DAPI = 4′,6-diamidino-2-phenylindole; CI = confidence intervals.
Figure 4.
Figure 4.
Stromal-selective cell death in tumors treated with FAP-activated prodrugs. A) FAP-positive stromal cells (red) selectively undergo apoptosis as indicated by TUNEL-positive (green) nuclei following treatment with a FAP-activated prodrug, ASGPAGP-A12ADT, whereas untreated control tumors show a more general pattern of cell death in MCF-7 xenografts. Nuclei are counterstained with DAPI (blue). Images are representative of three images per tumor and three tumors per group. Images were taken at both ×10 and ×20 magnifications. Scale bars = 100 μm. B) Stromal cells positive for α-smooth muscle actin (red) selectively undergo apoptosis as indicated by TUNEL-positive (green) nuclei following treatment with a FAP-activated prodrug (ASGPAGP-A12ADT or DSGETGP-A12ADT) compared with untreated control tumors from mice bearing MCF-7 xenografts. Nuclei are counterstained with DAPI (blue). Images are representative of three images per tumor and three tumors per group. Images were taken at ×20 magnification. Scale bars = 100 μm. C) There are approximately 90% more TUNEL-positive cells in tumors treated with a FAP-activated prodrug. Quantitation of images represented in (A). Average of 6–9 images per group. Error bars represent 95% CI. Asterisks indicate statistically significant P < .05, determined using mixed effects models. (Note: the analysis was based on each individual replicate, not their mean.) D) Approximately 80% of the total apoptotic (TUNEL-positive) cells from the FAP-activated prodrug-treated tumors are of stromal lineage compared with approximately 40% of the total TUNEL-positive cells in the untreated control tumors. Quantitation of images represented in (C). Average of nine images per group. Error bars represent 95% CI. Asterisks indicate statistically significant difference from untreated control, with P < .05 determined using mixed effects models (Note: the analysis used each individual replicate.) E) Treatment of tumors with a FAP-activated prodrug produces a bystander effect resulting in the death of cells adjacent to areas of FAP expression. White arrows indicate desmin-positive pericytes (left panel, red) and CD31-positive endothelial cells (right panel, red) in the stromal compartment undergoing apoptosis (TUNEL-positive, green) in FAP-activated prodrug-treated tumors. Nuclei are counterstained with DAPI (blue). Images taken at ×40 magnification. Scale bars = 50 μm. F) Stromal cells within regions of FAP (red) expression in xenografts begin to proliferate (arrows) following treatment with a FAP-activated prodrug (right panel) compared with those in untreated controls (left panel) as indicated by cells staining positive for an anti-mouse Ki-67-specific antibody (green). Nuclei are counterstained with DAPI (blue). Images are representative of six images per tumor and three tumors per group. Both images were taken at ×10 magnification. G) There is approximately fivefold greater proliferation of mouse stromal cells in MCF-7 xenografts treated with a FAP-activated prodrug. Quantitation of images represented in (F). Average of nine images per group. Error bars represent 95% CI. Asterisks indicate statistically significant difference from untreated control, with P < .05, determined using mixed effects models (Note: the analysis used each individual replicate.) TUNEL = terminal deoxynucleotidyl transferase dUTP nick end labeling; FAP = fibroblast activation protein α; RFU = relative fluorescence units; DAPI = 4′,6-diamidino-2-phenylindole; CI = confidence interval.
Figure 5.
Figure 5.
Therapeutic index and efficacy of FAP-activated prodrugs versus MCF-7 breast cancer xenografts in vivo. A) Maximum tolerated dose (MTD) of FAP prodrugs in Balb-C mice (n = 3 per group). The MTD of the FAP prodrugs was 100-fold higher than that of the active drug without the peptide carrier. The number of mice surviving each dosing level is listed as a fraction of the total number of mice dosed at that level. The number of consecutive daily doses given at each level is listed in parentheses. B) Mice (nine per group) treated with A12ADT intravenously (IV) at the MTD (approximately 0.3mg/kg) for three consecutive doses had no effect on the growth of MCF-7 xenografts compared with vehicle controls. Error bars represent 95% CI. C) Half-life (t 1/2) of ASGPAGP-A12ADT in mouse plasma was determined to be approximately 4.5 hours with no accumulation of the prodrug seen at 24 hours following the second and third doses. Inset shows that activation of the prodrug in mouse plasma in vivo represents less than 0.1% of the total amount given and is cleared rapidly. D) Mice bearing MCF-7 xenografts were treated intravenously with a single 3-day course of 100 nmoles/day (approximately 6–7mg/kg/day) with one of two FAP-activated prodrugs (ASGPAGP-A12ADT or DSGETGP-A12ADT) and compared with untreated control tumors. Graph represents the cumulative mean of four independent experiments with approximately nine mice/group/experiment. Error bars represent 95% CI. Asterisks indicate statistically significant P < .05, determined using permutation test to compare means at each point. E) Mice bearing MCF-7 xenografts were treated with either a FAP-activated prodrug (ASGPAGP-A12ADT) or one of two non-FAP cleavable prodrug analogs (PETGRSG-E12ADT or ERGETGp-S12ADT, where “p” represents d-isomer of Pro) and compared with untreated control tumors. Treatment regimen consisted of two intravenous courses of three consecutive daily 100 nmole (~6–7mg/kg) doses with a 2-week recovery period between cycle initiations. Each group contained 10–11 mice in a single experiment. Error bars represent 95% CI. Asterisks indicate statistically significant differences from untreated control, with P < .05, determined using permutation test to compare means at each point. F) Effect of FAP-activated prodrug therapy on the body weight of mice. Error bars represent 95% CI. G) Active drug accumulation within the stromal compartment of tumors treated with a FAP-activated prodrug. Three animals bearing MCF-7 xenografts were treated with a FAP-activated prodrug, ERGETGP-S12ADT, for a single intravenous 3-day course of 100 nmoles/day (6.8mg/kg/day). Harvested tumors were digested and fractionated into epithelial and stromal cell populations based upon EpCAM expression. Concentrations of active drug present in these fractions were determined by LCMS, normalized to cell number, and expressed as a ratio (stromal:epithelial). CI = confidence interval; FAP = fibroblast activation protein α.
Figure 5.
Figure 5.
Therapeutic index and efficacy of FAP-activated prodrugs versus MCF-7 breast cancer xenografts in vivo. A) Maximum tolerated dose (MTD) of FAP prodrugs in Balb-C mice (n = 3 per group). The MTD of the FAP prodrugs was 100-fold higher than that of the active drug without the peptide carrier. The number of mice surviving each dosing level is listed as a fraction of the total number of mice dosed at that level. The number of consecutive daily doses given at each level is listed in parentheses. B) Mice (nine per group) treated with A12ADT intravenously (IV) at the MTD (approximately 0.3mg/kg) for three consecutive doses had no effect on the growth of MCF-7 xenografts compared with vehicle controls. Error bars represent 95% CI. C) Half-life (t 1/2) of ASGPAGP-A12ADT in mouse plasma was determined to be approximately 4.5 hours with no accumulation of the prodrug seen at 24 hours following the second and third doses. Inset shows that activation of the prodrug in mouse plasma in vivo represents less than 0.1% of the total amount given and is cleared rapidly. D) Mice bearing MCF-7 xenografts were treated intravenously with a single 3-day course of 100 nmoles/day (approximately 6–7mg/kg/day) with one of two FAP-activated prodrugs (ASGPAGP-A12ADT or DSGETGP-A12ADT) and compared with untreated control tumors. Graph represents the cumulative mean of four independent experiments with approximately nine mice/group/experiment. Error bars represent 95% CI. Asterisks indicate statistically significant P < .05, determined using permutation test to compare means at each point. E) Mice bearing MCF-7 xenografts were treated with either a FAP-activated prodrug (ASGPAGP-A12ADT) or one of two non-FAP cleavable prodrug analogs (PETGRSG-E12ADT or ERGETGp-S12ADT, where “p” represents d-isomer of Pro) and compared with untreated control tumors. Treatment regimen consisted of two intravenous courses of three consecutive daily 100 nmole (~6–7mg/kg) doses with a 2-week recovery period between cycle initiations. Each group contained 10–11 mice in a single experiment. Error bars represent 95% CI. Asterisks indicate statistically significant differences from untreated control, with P < .05, determined using permutation test to compare means at each point. F) Effect of FAP-activated prodrug therapy on the body weight of mice. Error bars represent 95% CI. G) Active drug accumulation within the stromal compartment of tumors treated with a FAP-activated prodrug. Three animals bearing MCF-7 xenografts were treated with a FAP-activated prodrug, ERGETGP-S12ADT, for a single intravenous 3-day course of 100 nmoles/day (6.8mg/kg/day). Harvested tumors were digested and fractionated into epithelial and stromal cell populations based upon EpCAM expression. Concentrations of active drug present in these fractions were determined by LCMS, normalized to cell number, and expressed as a ratio (stromal:epithelial). CI = confidence interval; FAP = fibroblast activation protein α.
Figure 6.
Figure 6.
Efficacy of FAP-activated prodrugs versus LNCaP prostate cancer xenografts in vivo. A) FAP expression in the stroma of LNCaP human prostate cancer xenografts as indicated by the colocalization of both FAP (green) and α-smooth muscle actin (red). Nuclei are counterstained with DAPI (blue). Images are representative and were taken at ×20 (left panel) and ×40 (right panel) magnification. Scale bars: left panel, 100 μm; right panel 50 μm. B) Male nude mice (10 per group) bearing LNCaP xenografts were treated intravenously with a single 3-day course of 100 nmoles/day (6.8mg/kg/day) with a FAP-activated prodrug, ERGETGP-S12ADT, and compared with untreated controls. Error bars represent 95% CI. Asterisks indicate statistically significant differences from untreated control, with P < .05, determined using permutation test to compare means at each point. C) Mice bearing LNCaP xenografts (Figure 5, B) treated with the ERGETGP-S12ADT FAP-activated prodrug showed minimal weight loss (<15%) and returned to baseline within 1 week after cessation of therapy. Error bars represent 95% CI. Asterisks indicate statistically significant differences from untreated control, with P < .05, determined using permutation test to compare means at each point. FAP = fibroblast activation protein α; DAPI = 4′, 6-diamidino-2-phenylindole; CI = confidence interval.

Similar articles

Cited by

References

    1. Bast R Jr Kufe DW Pollock RE Weichselbaum RR Holland JF Frei E III Gansler TS Cancer Medicine. 5thed. Hamilton, ON: Decker BC; 2000.
    1. Hewitt RE, Powe DG, Carter GI, Turner DR. Desmoplasia and its relevance to colorectal tumour invasion. Int J Cancer 1993;53(1):62–69 - PubMed
    1. Rønnov-Jessen L, Petersen OW, Bissell MJ. Cellular changes involved in conversion of normal to malignant breast: importance of the stromal reaction. Physiol Rev 1996;76(1):69–125 - PubMed
    1. Mueller MM, Fusenig NE. Friends or foes—bipolar effects of the tumour stroma in cancer. Nat Rev Cancer 2004;4(11):839–849 - PubMed
    1. Allinen M, Beroukhim R, Cai L, et al. Molecular characterization of the tumor microenvironment in breast cancer. Cancer Cell 2004;6(1):17–32 - PubMed

Publication types

MeSH terms