. 2012;7(7):e40378.
doi: 10.1371/journal.pone.0040378. Epub 2012 Jul 20.

The epithelial-mesenchymal transition (EMT) regulatory factor SLUG (SNAI2) is a downstream target of SPARC and AKT in promoting melanoma cell invasion

Affiliations

The epithelial-mesenchymal transition (EMT) regulatory factor SLUG (SNAI2) is a downstream target of SPARC and AKT in promoting melanoma cell invasion

Nina Fenouille et al. PLoS One. 2012.

Abstract

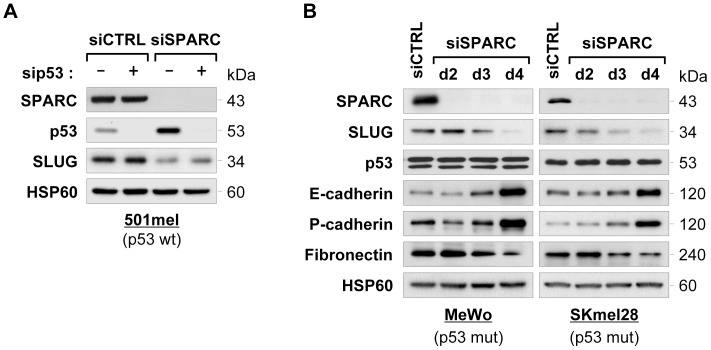
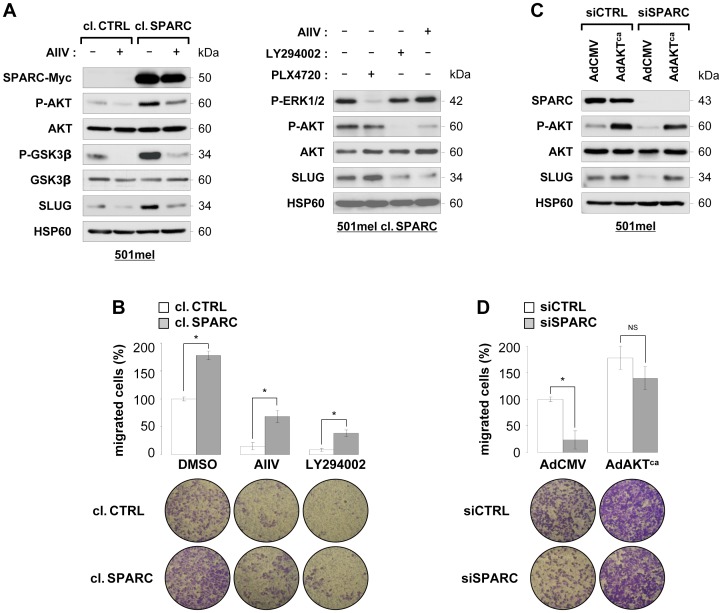
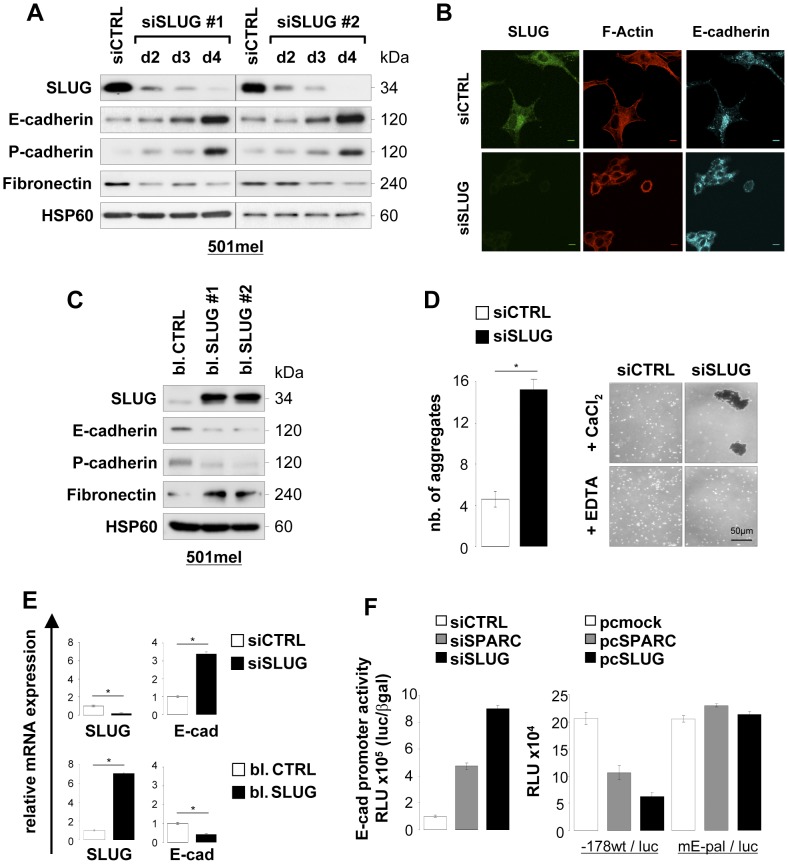
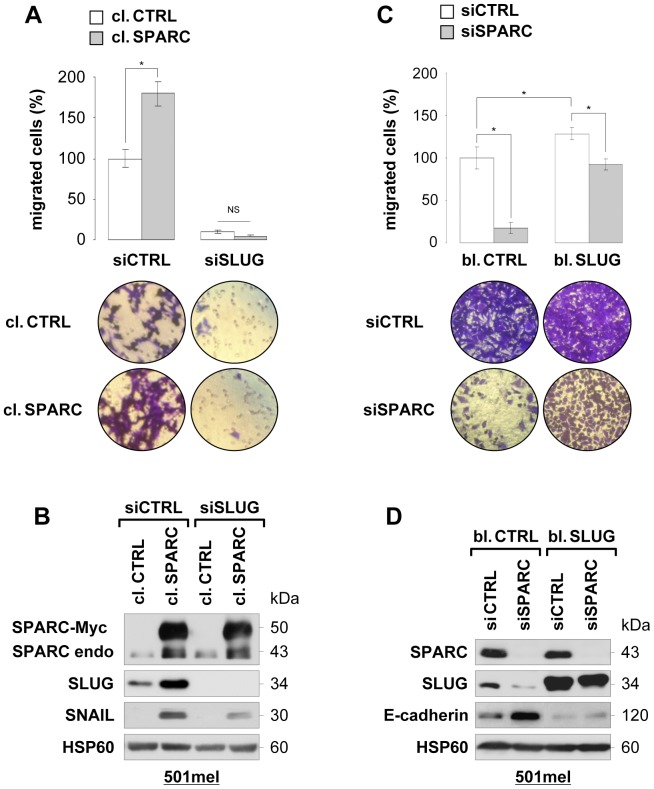
During progression of melanoma, malignant melanocytes can be reprogrammed into mesenchymal-like cells through a process similar to epithelial-mesenchymal transition (EMT), which is associated with downregulation of the junctional protein E-cadherin and acquisition of a migratory phenotype. Recent evidence supports a role for SLUG, a transcriptional repressor of E-cadherin, as a melanocyte lineage transcription factor that predisposes to melanoma metastasis. However, the signals responsible for SLUG expression in melanoma are unclear and its role in the invasive phenotype is not fully elucidated. Here, we report that SLUG expression and activation is driven by SPARC (also known as osteonectin), a secreted extracellular matrix-associated factor that promotes EMT-like changes. Ectopic expression or knockdown of SPARC resulted in increased or reduced expression of SLUG, respectively. SLUG increase occurred concomitantly with SPARC-mediated downregulation of E-cadherin and P-cadherin, and induction of mesenchymal traits in human melanocytes and melanoma cells. Pharmacological blockade of PI3 kinase/AKT signaling impeded SPARC-induced SLUG levels and cell migration, whereas adenoviral introduction of constitutively active AKT allowed rescue of SLUG and migratory capabilities of SPARC knockdown cells. We also observed that pharmacological inhibition of oncogenic BRAF(V600E) using PLX4720 did not influence SLUG expression in melanoma cells harboring BRAF(V600E). Furthermore, SLUG is a bona fide transcriptional repressor of E-cadherin as well as a regulator of P-cadherin in melanoma cells and its knockdown attenuated invasive behavior and blocked SPARC-enhanced cell migration. Notably, inhibition of cell migration in SPARC-depleted cells was rescued by expression of a SLUG transgene. In freshly isolated metastatic melanoma cells, a positive association between SPARC and SLUG mRNA levels was also found. These findings reveal that autocrine SPARC maintains heightened SLUG expression in melanoma cells and indicate that SPARC may promote EMT-associated tumor invasion by supporting AKT-dependent upregulation of SLUG.


Conflict of interest statement

Competing Interests: The authors have declared that no competing interests exist.

Figures

Figure 1
Figure 1. SPARC controls SLUG expression and other markers of the EMT-like transition in melanoma cells and primary melanocytes.
(A) Analysis of EMT regulators mRNA levels: RNAs were prepared from 501mel cells infected with control adenovirus (AdCTRL) or adenovirus-expressing SPARC (AdSPARC) for 3 days. Relative gene expression levels of the indicated E-cadherin repressors were analyzed by SYBR green-based real-time Q-PCR. Data are expressed in arbitrary units as fold change between AdSPARC-infected and control cells. Columns, mean of three independent amplifications performed in duplicate; error bars, SD. *P<0.05; NS, not significant (Student’s test). (B) Expression levels of EMT markers in SPARC overexpressing melanoma cells: immunoblots of 501mel cells infected with control adenovirus (AdCTRL) or adenovirus-expressing SPARC (AdSPARC) for the indicated times, and of 501mel cell clones expressing SPARC (cl. SPARC #1 and #2) or control vector (cl. CTRL). Total protein lysates and cell supernatants were analyzed for expression of SPARC-Myc transgene, endogenous SPARC, SLUG, E-cadherin, P-cadherin and Fibronectin. HSP60 and Ponceau S-stained bands were used as loading controls in lysates and culture media, respectively. (C) SPARC induces an EMT-like phenotype: F-actin and immunofluorescent staining of 501mel cell clones expressing SPARC (cl.SPARC) or control vector (cl. CTRL). Cells were co-stained with Texas Red-X phalloidin, anti-SLUG (green) and anti-E-cadherin (cyan) and imaged with confocal microscopy. Merged images of the corresponding three channels are presented. In separate panels, fluorescence signal specific to Fibronectin antibody was visualized as blue. Bars, 10 µm. (D) SPARC promotes EMT-like transition in melanocytes: immunoblots of normal human melanocytes (NHM) infected with control adenovirus (AdCTRL) or adenovirus-expressing SPARC (AdSPARC) for 4 days. Total protein lysates and cell supernatants were analyzed for expression of the indicated proteins.
Figure 2
Figure 2. siRNA-mediated knockdown of SPARC decreases SLUG and restores E-cadherin and P-cadherin expression.
(A) Expression levels of EMT markers in SPARC-depleted cells: immunoblots of 501mel cells transfected with control siRNA (siCTRL) for 4 days or two SPARC siRNAs for the indicated times (left), and of WM9 cells transfected with siCTRL or siSPARC #2 for 4 days (right). Total protein lysates and cell supernatants were analyzed for expression of the indicated proteins. (B) Morphology of SPARC-depleted cells: F-actin and immunofluorescent staining of 501mel cells transfected with control siRNA (siCTRL) or SPARC siRNA (siSPARC). After 4 days, cells were co-stained with Texas Red-X phalloidin, anti-SPARC (green) and anti-Fibronectin (cyan) and imaged with confocal microscopy. Merged images of the corresponding three channels are presented. Bottom panels, expression of SLUG (green) and E-cadherin (cyan) was analyzed by immunofluorescence staining. Bars, 10 µm.
Figure 3
Figure 3. siRNA-mediated knockdown of SPARC decreases SLUG expression in a p53-independent manner.
(A) Analysis of SLUG expression in p53 and SPARC co-depleted cells: 501mel cells were transfected for 3 days with control siRNA (siCTRL), p53 siRNA (sip53), SPARC siRNA (siSPARC) alone or in combination at 50 nM final concentration. Total protein lysates from resulting cells were analyzed by immunoblotting for expression of SPARC, p53, SLUG and HSP60 (loading control), as indicated. (B) Analysis of SLUG expression after SPARC depletion in p53-mutated melanoma cells: MeWo and SKmel28 cells were transfected with control siCTRL for 4 days or siSPARC for the indicated times. Expression levels of SPARC, SLUG, p53 E-cadherin, P-cadherin, Fibronectin and HSP60 (loading control) were analyzed by immunoblotting.
Figure 4
Figure 4. SPARC-mediated SLUG expression and promotion of melanoma cell migration is PI3K/AKT dependent.
(A) Influence of PI3K/AKT and BRAFV600E signaling on SLUG expression: left panel, 501mel cells control (cl. CTRL) or overexpressing SPARC (cl. SPARC) were treated with DMSO or 10 mmol/L AKT inhibitor IV (AIIV). Immunoblots show the phosphorylation status of AKT (Ser473) and GSK3β (Ser9) and expression levels of SPARC-Myc transgene, AKT, GSK3β and SLUG. Right panel, 501mel cl. SPARC cells were treated with DMSO or 10 mmol/L AIIV, LY294002 or PLX4720 for 3 hours. Immunoblots show the phosphorylation status of MAP kinases ERK and AKT and expression levels of SLUG. HSP60 was used as a loading control. (B) Influence of PI3K/AKT signaling on cell migration: serum-stimulated cell migration was analyzed using Boyden chamber assays in control and SPARC 501mel cells treated with DMSO or 10 mmol/L AIIV or LY294002 as indicated. Results are expressed in percent of control. Columns, means of triplicates from two independent experiments; error bars, SD. *P<0.05 (Student’s test). Representative images of lower surface of membranes are shown. (C) Expression of Myr-AKT protects from SLUG decrease after SPARC depletion: 501mel cells were infected with a control empty adenovirus (AdCMV) or with adenovirus encoding the constitutively active mutant Myr-HA-AKT1 (AdAKTca) and transfected 6 hours later with 50 nM siCTRL or siSPARC for 3 days. Cells were harvested and proteins were analyzed by immunolotting using the indicated antibodies. (D) Expression of Myr-AKT rescues migratory defects of SPARC-depleted cells: serum-stimulated cell migration was analyzed using Boyden chamber assays in 501mel cells infected with AdCMV or AdAKTca and after depletion for endogenous SPARC as described above. Results are expressed in percent of control. Columns, means of triplicates from two independent experiments; error bars, SD. P<0.05; NS, not significant (Student’s test). Representative images of lower surface of membranes are shown.
Figure 5
Figure 5. Knockdown or overexpression of SLUG modulates E-cadherin and P-cadherin adhesion molecules.
(A) Expression levels of EMT markers in SLUG-depleted cells: 501mel cells were transfected with control siRNA (siCTRL) for 4 days or two SLUG siRNAs (siSLUG #1 and #2) for the indicated times. Expression levels of SLUG, E-cadherin, P-cadherin and Fibronectin were analyzed by immunoblotting. HSP60 was used as loading control. (B) Morphology of SLUG-depleted cells: expression of SLUG (green), E-cadherin (cyan) and actin cytoskeleton (Texas Red-X phalloidin) following siRNA-mediated SLUG depletion in 501mel cells was analyzed by fluorescence staining and confocal microscopy. Bars, 10 µm. (C) Ectopic SLUG expression induces an EMT-like phenotype: control (bl. CTRL) or SLUG-overexpressing (bl. SLUG #1 and #2) 501mel cell populations were analyzed by immunoblotting for expression of SLUG, E-cadherin, P-cadherin, Fibronectin and HSP60 (loading control). (D) Depletion of SLUG increases Ca2+-dependent cell-cell adhesion: adhesion assays were performed as described in the Materials and Methods after treatment of 501mel cells with siCTRL or siSLUG as indicated. The phase-contrast pictures show aggregates formed in presence of 1 mmol/L CaCl2 alone or with 3 mmol/L EDTA. The average of two independent adhesion assays and SD are presented. Columns, average of two independent assays; error bars, SD. *P<0.05 (Student’s test). (E) SLUG regulates E-cadherin mRNA levels: RNAs were prepared from 501mel cells transfected with siCTRL or siSLUG for 4 days, and from bulk selected control or SLUG-overexpressing 501mel cells. The relative mRNA expression levels of SLUG and E-cadherin were measured by SYBR green-based real-time Q-PCR. Columns, mean of three independent amplifications performed in duplicate; error bars, SD. *P<0.05 (Student’s test). (F) E-cadherin promoter activity: 501mel cells were transfected with siCTRL, siSPARC or siSLUG, and 24 hours later with wild-type E-cadherin promoter reporter construct (left). 501mel cells were co-transfected with an empty vector (mock) or vectors expressing SPARC or SLUG and wild-type (−178 wt/luc) or mutant (mE-pal/luc) E-cadherin promoter reporter constructs (right). After 3 days, luciferase activities were measured and normalized to β-galactosidase activities. Columns, mean of triplicates; errors bars, SD.
Figure 6
Figure 6. siRNA-mediated knockdown of SPARC or SLUG and inhibition of AKT signaling reduce invasion into 3-dimensional collagen matrix.
(A) Depletion of SPARC or SLUG decreases tumor spheroid invasion: preformed melanoma spheroids of 501mel, WM9 and WM793 cells transfected with siCTRL, siSPARC or siSLUG as indicated were implanted into a gel of collagen type I. Spheroids were incubated in growth medium for 3 days and tumor cell outgrowth was visualized by phase contrast microscopy. (B) Influence of PI3K/AKT signaling on spheroid invasion: preformed melanoma spheroids of 501mel, WM9 and WM793 were implanted into a gel of collagen type I and incubated in growth medium for 3 days with with DMSO or 10 mmol/L AIIV or LY294002. Tumor cell invasion was visualized as above. Representative example of spheroids from each culture is shown.
Figure 7
Figure 7. SLUG plays a critical role in SPARC-mediated melanoma cell migration.
(A) Depletion of SLUG blunts SPARC-induced cell migration: 501mel cells control (cl. CTRL) or overexpressing SPARC (cl. SPARC) were transfected with control siRNA (siCTRL) or SLUG siRNAs (siSLUG) for 4 days. Chemotaxis was assassed using Boyden chamber assays. Cells were left to migrate for 20 hours, then fixed, stained and counted. Results are expressed in percent of control. Columns, means of triplicates from two independent experiments; error bars, SD. *P<0.05; NS, not significant (Student’s test). Representative images of lower surface of membranes are shown. (B) Analysis of SLUG expression: levels of SPARC-Myc transgene, endogenous SPARC, SLUG, SNAIL and HSP60 (loading control) in the resulting cells were analyzed by immunoblotting. (C) Ectopic expression of SLUG bypasses migratory defects of SPARC-depleted cells: Control (bl. CTRL) or SLUG-overexpressing (bl. SLUG) 501mel cells were transfected with control siRNA (siCTRL) or SPARC siRNAs (siSPARC) for 4 days. Chemotaxis was assessed using Boyden chamber assays as described in (A). *P<0.05 (Student’s test). (D) Analysis of E-cadherin expression: levels of SPARC, SLUG, E-cadherin and HSP60 (loading control) in the resulting cells were analyzed by immunoblotting.
Figure 8
Figure 8. mRNA levels of SPARC and SLUG in melanoma cells at various stages of tumor development.
(A) Analysis of SPARC and SLUG mRNA levels: relative gene expression levels of SPARC and SLUG in cultures of melanoma cells derived from RGP, VGP or metastatic melanoma tumors were evaluated by relative Q-PCR using an ABI Biosystems 7900HT Fast Real Time PCR System and the SYBR Green dye detection protocol. Data were analyzed using the 2−ddCt method and human 18S transcript level was used to normalize for each sample. Values are the mean of independent triplicates. RGP, Radial Growth Phase; VGP, Vertical Growth Phase. (B) Positive correlation between SPARC and SLUG in melanoma samples: regression analysis to determine the correlation between SPARC and SLUG in human melanoma samples. R, Spearman’s Rank Correlation Coefficient; P<0.05 (Spearman’s test).

References

    1. Thiery JP, Acloque H, Huang RY, Nieto MA. Epithelial-mesenchymal transitions in development and disease. Cell. 2009;139:871–890. - PubMed
    1. Peinado H, Olmeda D, Cano A. SNAIL, Zeb and bHLH factors in tumour progression: an alliance against the epithelial phenotype? Nat Rev Cancer. 2007;7:415–428. - PubMed
    1. Chin L, Garraway LA, Fisher DE. Malignant melanoma: genetics and therapeutics in the genomic era. Genes Dev. 2006;20:2149–2182. - PubMed
    1. Pla P, Moore R, Morali OG, Grille S, Martinozzi S, et al. Cadherins in neural crest cell development and transformation. J Cell Physiol. 2001;189:121–132. - PubMed
    1. Miller AJ, Mihm MC., Jr Melanoma. N Engl J Med. 2006;355:51–65. - PubMed

Publication types

MeSH terms