. 2012;7(7):e41099.
doi: 10.1371/journal.pone.0041099. Epub 2012 Jul 20.

Hydrogen peroxide alters splicing of soluble guanylyl cyclase and selectively modulates expression of splicing regulators in human cancer cells

Affiliations

Hydrogen peroxide alters splicing of soluble guanylyl cyclase and selectively modulates expression of splicing regulators in human cancer cells

Gilbert J Cote et al. PLoS One. 2012.

Abstract

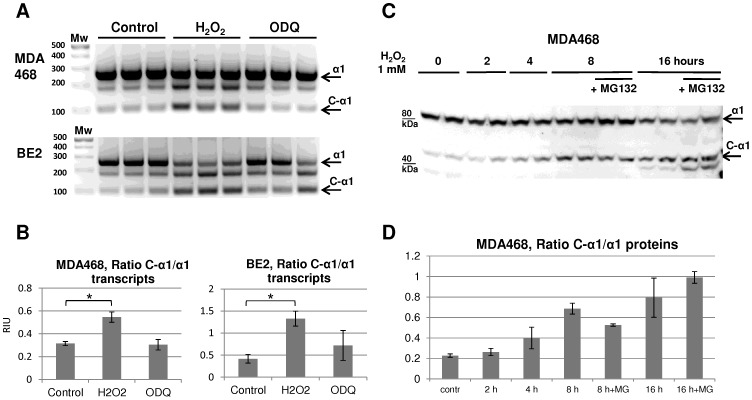
Background: Soluble guanylyl cyclase (sGC) plays a central role in nitric oxide (NO)-mediated signal transduction in the cardiovascular, nervous and gastrointestinal systems. Alternative RNA splicing has emerged as a potential mechanism to modulate sGC expression and activity. C-α1 sGC is an alternative splice form that is resistant to oxidation-induced protein degradation and demonstrates preferential subcellular distribution to the oxidized environment of endoplasmic reticulum (ER).

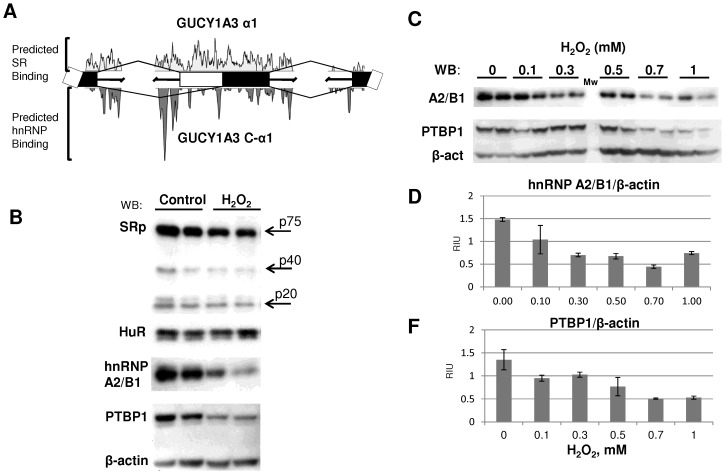
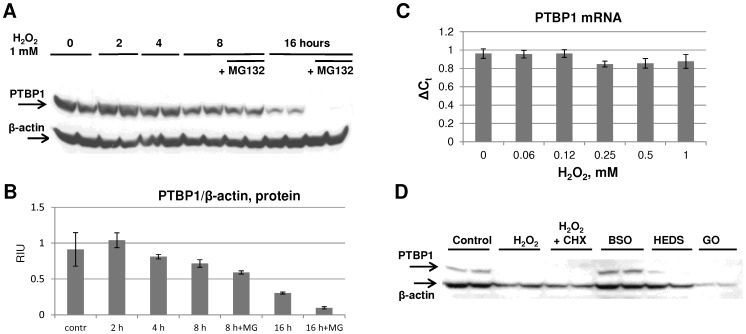
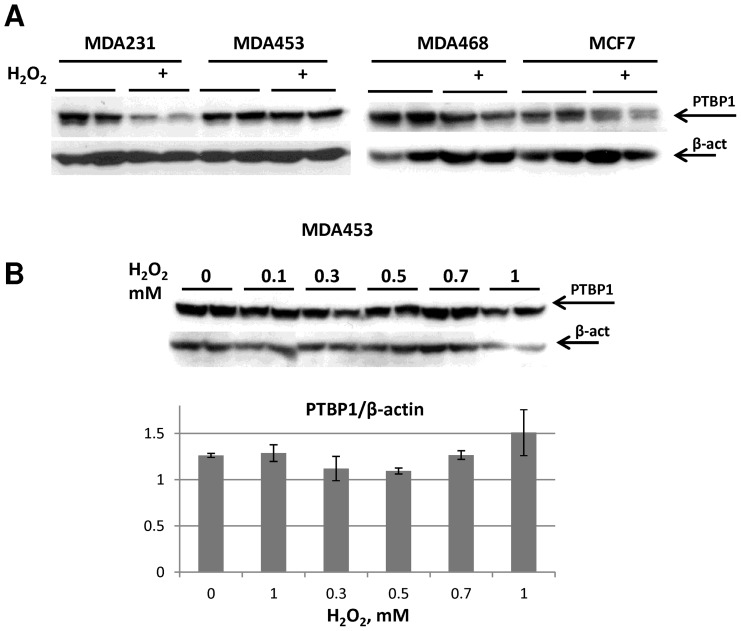
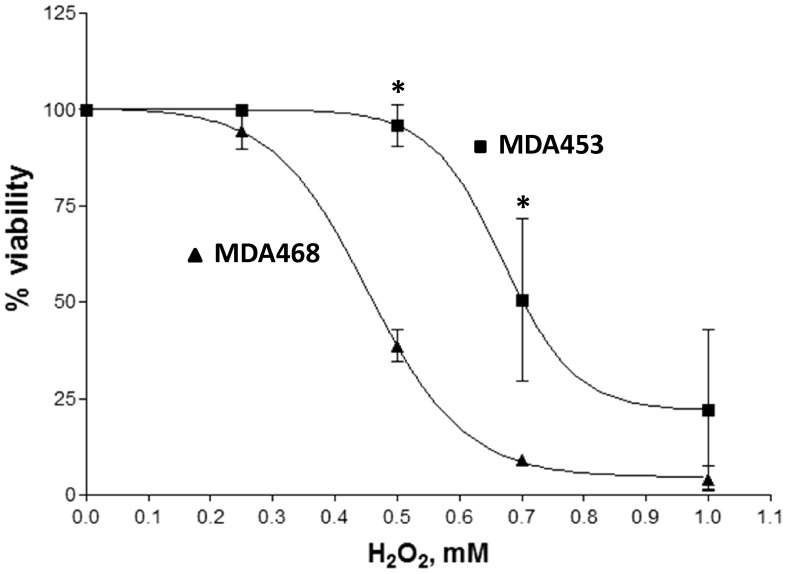
Methodology/principal findings: Here we report that splicing of C-α1 sGC can be modulated by H(2)O(2) treatment in BE2 neuroblastoma and MDA-MD-468 adenocarcinoma human cells. In addition, we show that the H(2)O(2) treatment of MDA-MD-468 cells selectively decreases protein levels of PTBP1 and hnRNP A2/B1 splice factors identified as potential α1 gene splicing regulators by in silico analysis. We further demonstrate that down-regulation of PTBP1 by H(2)O(2) occurs at the protein level with variable regulation observed in different breast cancer cells.

Conclusions/significance: Our data demonstrate that H(2)O(2) regulates RNA splicing to induce expression of the oxidation-resistant C-α1 sGC subunit. We also report that H(2)O(2) treatment selectively alters the expression of key splicing regulators. This process might play an important role in regulation of cellular adaptation to conditions of oxidative stress.


Conflict of interest statement

Competing Interests: The authors have declared that no competing interests exist.

Figures

Figure 1
Figure 1. H2O2 exposure induces the expression of oxidation-resistant C-α1 sGC splice form in MDA468 and BE2 cells. A
: RT-PCR detection of α1 (top) and C-α1 (bottom band) sGC transcripts following treatment with H2O2 (1 mM) or ODQ (20 µM), as indicated. RT-PCR products are separated on 3% agarose gel and stained with Ethidium Bromide. Upper band represents the message encoding canonical α1 protein (Transcripts 1–4, 270 bp); middle band is a non-specific product; bottom band indicates the C-α1 sGC transcript (Transcript 5, 94 bp). Biological triplicates representative of three independent experiments are shown. B: Ratio (mean ± SD) of the relative abundance of C-α1 and α1 transcripts quantified by densitometry. *p<0.05 by Student's t-test. C: Western blot detection of α1 (top) and C-α1 (bottom) proteins. MDA468 cells were treated with 1 mM H2O2 as indicated in presence or absence of MG132 (10 µM). Shown blots are representative of four independent experiments with similar results. D: Ratio of the relative abundance of C-α1 and α1 proteins quantified by densitometry. Data are shown as mean ± SD from four independent experiments.
Figure 2
Figure 2. H2O2 exposure selectively alters the expression of splice factors predicted to regulate sGC splicing in MDA468 cells.
A: Schematic representation of GUCY1A3 alternative splicing to generate C-α1. The relative distribution of predicted SR and hnRNP binding sites is shown. B: Western analysis of PTBP1, hnRNP2A/1B, HuR and SR proteins expression in control and H2O2-treated (1 mM, 24 hours) MDA468 cells. C: H2O2 dose-dependent assessment of PTBP1 and hnRNP A2/B1 protein levels in MDA468 cells. Shown Western blots are representative of at least three independent experiments with similar results. D, F: Densitometry analysis of PTBP1 and hnRNP A2/B1 protein levels normalized on β-actin. Data are shown as mean ±SD from three independent experiments.
Figure 3
Figure 3. Insights into the mechanism of H2O2-induced PTBP1 down-regulation.
A: PTBP1 degradation occurs in time-dependent manner and is not prevented by proteasome inhibitor MG132. MDA468 cells were treated as in Fig. 1C with 1 mM H2O2 in the presence or absence of MG132 (10 µM). Western blot analysis was performed to visualize the expression of PTBP1. β-actin served as a loading control. Biological duplicates for each treatment are shown; blots are representative of three independent experiments with similar results. B: Densitometry analysis of PTBP1 protein levels normalized on β-actin. Averages for representative biological duplicates for each treatment are shown. C: H2O2 exposure does not affect PTBP1 mRNA levels. MDA468 cells were treated with indicated concentrations of H2O2 for 24 hours. Relative abundance of PTBP1 mRNA in samples was analyzed by RT-qPCR analysis. Average ΔCt ± SD for biological triplicates are shown. D: PTBP1 degradation depends on thiol oxidation and is not rescued by inhibition of de novo protein synthesis. Western blot analysis performed on MDA468 cell lysates treated for 24 hours with inhibitor of protein synthesis cycloxemide (2 µg/ml) and different factors inducing oxidative stress: 1 mM BSO (GSH depletion inducer); 1 mM HEDS (thiol oxidation inducer) and 0.01 units/ml of Glucose Oxidase (increases production of ROS). Shown Western blots are representative of three independent experiments with similar results.
Figure 4
Figure 4. PTBP1 response to H2O2-induced degradation varies in different breast cancer cell lines.
A: Western blot analysis examining PTBP1 expression in MDA231, MDA453, MDA468 and MCF7 cells treated with 1 mM H2O2 for 18 hours. Representative biological duplicates are shown. B: MDA453 cells are resistant to H2O2-induced PTBP1 degradation. Top panel: MDA453 cell were treated with different concentration of H2O2 and cell lysates were subjected to Western blot analysis with antibodies towards PTBP1 and β-actin. Shown blots are representative of four independent experiments with similar results. Bottom panel: densitometry analysis of PTBP1 protein levels normalized on β-actin levels. Averages for representative biological duplicates for each treatment are shown.
Figure 5
Figure 5. H2O2 cytotoxicity analysis in MDA468 and MDA453 cells.
Survival curve was generated in response to H2O2 dosage using trypan exclusion method and expressed as % of survival to untreated controls. Mean ± SD of three independent passages performed in triplicates are shown, *- p<0.05 by Student's t-test in comparison to control.

References

    1. Keene JD. RNA regulons: coordination of post-transcriptional events. Nat Rev Genet. 2007;8:533–543. - PubMed
    1. Shin C, Manley JL. Cell signalling and the control of pre-mRNA splicing. Nat Rev Mol Cell Biol. 2004;5:727–738. - PubMed
    1. Pleiss JA, Whitworth GB, Bergkessel M, Guthrie C. Rapid, transcript-specific changes in splicing in response to environmental stress. Mol Cell. 2007;27:928–937. - PMC - PubMed
    1. Shi Y, Manley JL. A complex signaling pathway regulates SRp38 phosphorylation and pre-mRNA splicing in response to heat shock. Mol Cell. 2007;28:79–90. - PubMed
    1. Irani K, Xia Y, Zweier JL, Sollott SJ, Der CJ, et al. Mitogenic signaling mediated by oxidants in Ras-transformed fibroblasts. Science. 1997;275:1649–1652. - PubMed

Publication types

MeSH terms

Substances