

Structure and dynamics of amyloid-β segmental polymorphisms
- PMID: 22911797
- PMCID: PMC3404032
- DOI: 10.1371/journal.pone.0041479
Structure and dynamics of amyloid-β segmental polymorphisms
Abstract
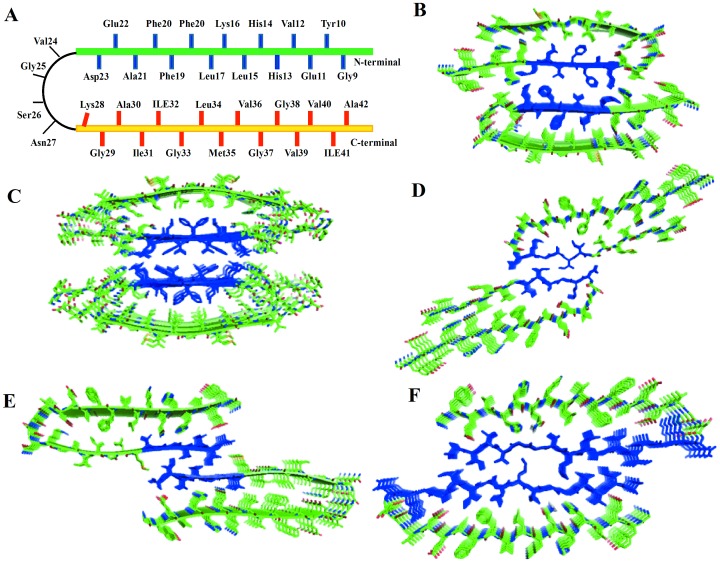
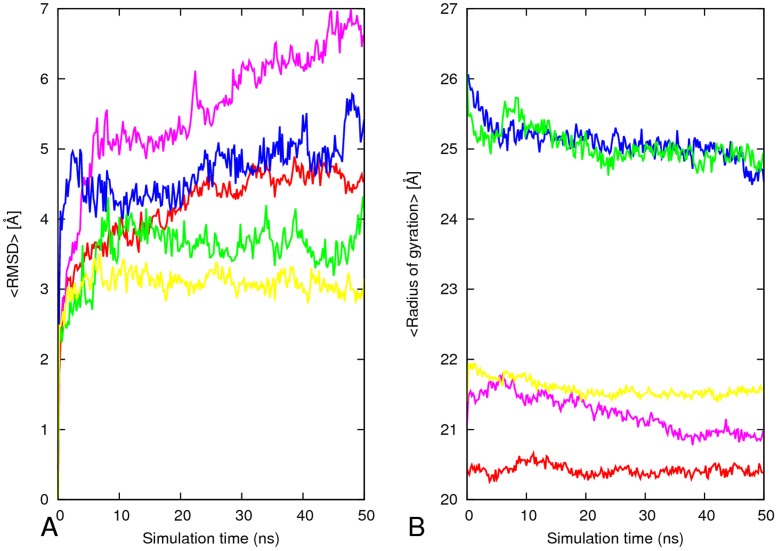
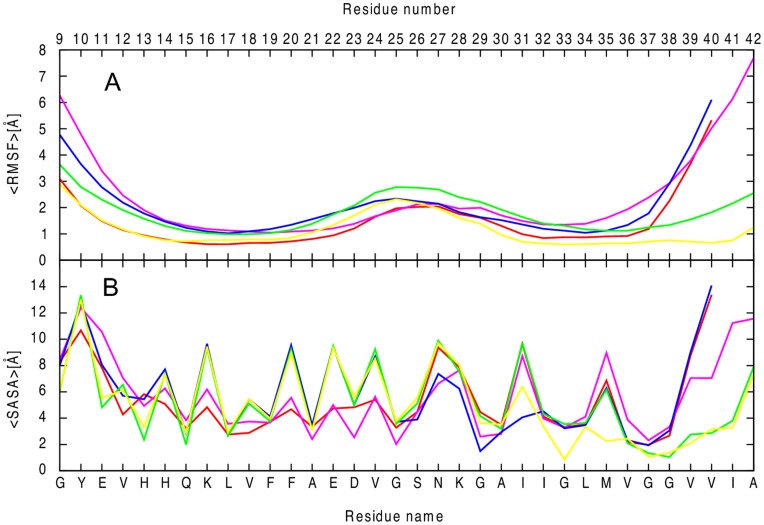
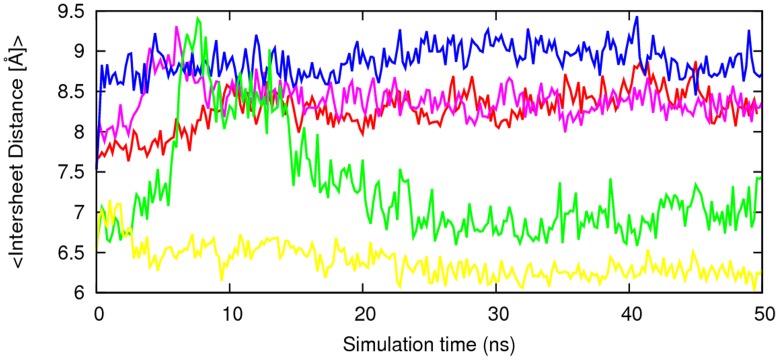
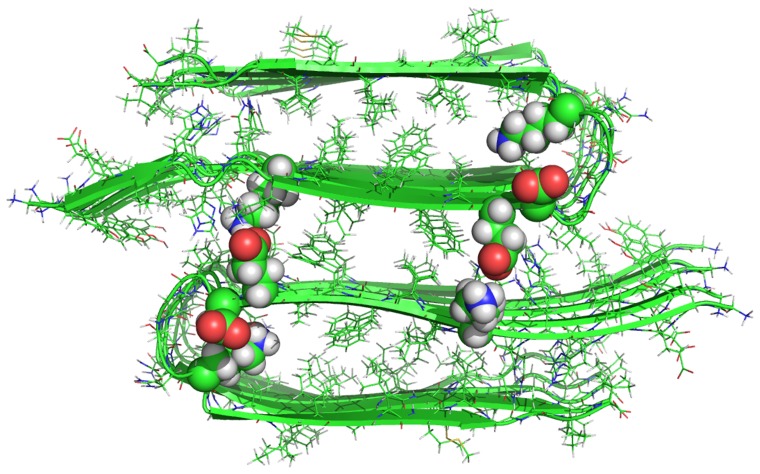
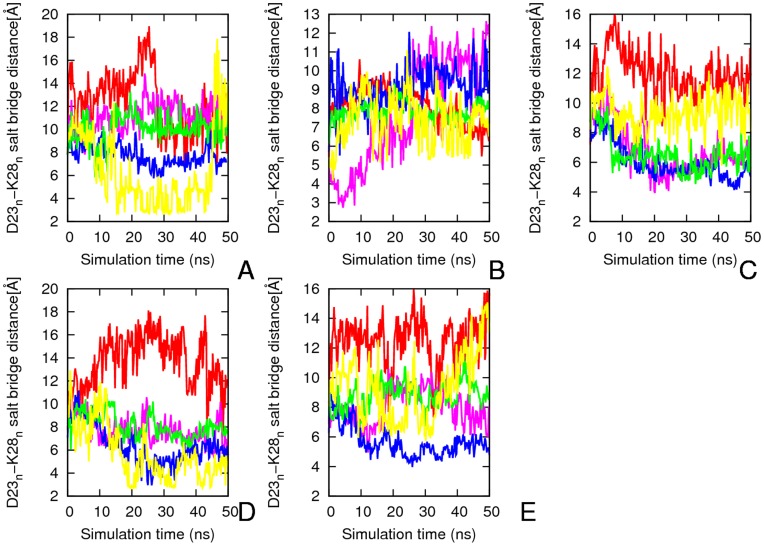
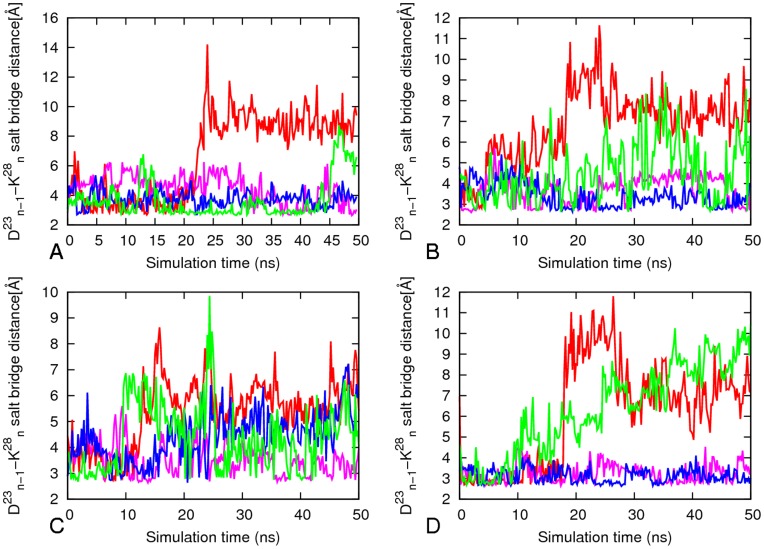
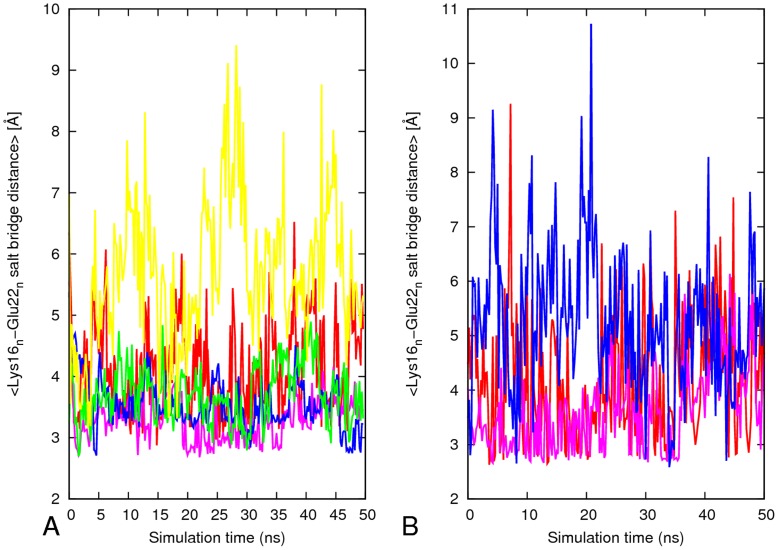
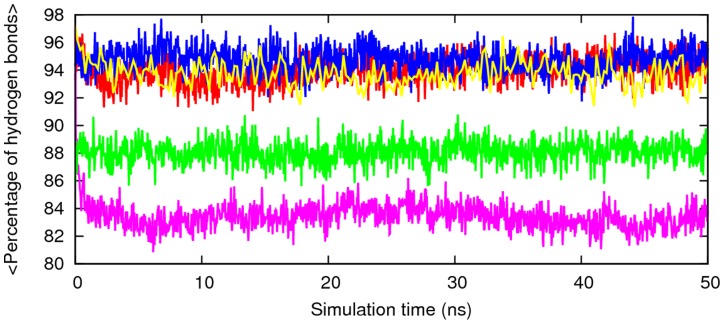
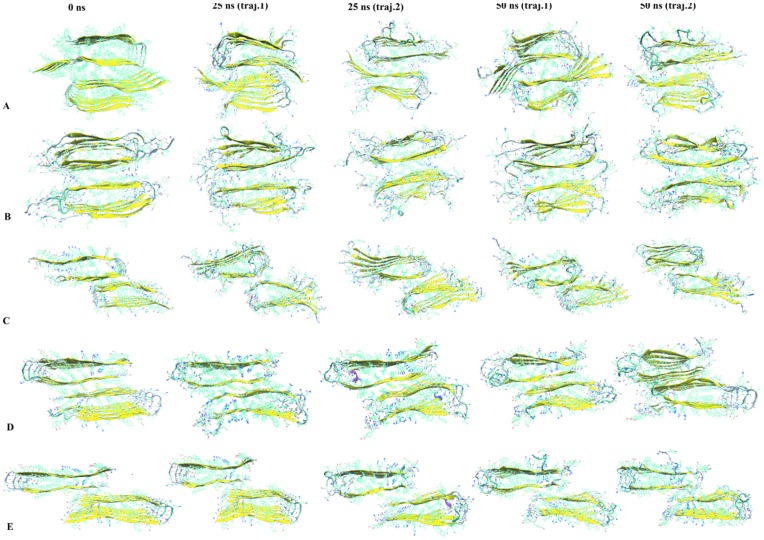
It is believed that amyloid-beta (Aβ) aggregates play a role in the pathogenesis of Alzheimer's disease. Aβ molecules form β-sheet structures with multiple interaction sites. This polymorphism gives rise to differences in morphology, physico-chemical property and level of cellular toxicity. We have investigated the conformational stability of various segmental polymorphisms using molecular dynamics simulations and find that the segmental polymorphic models of Aβ retain a U-shaped architecture. Our results demonstrate the importance of inter-sheet side chain-side chain contacts, hydrophobic contacts among the strands (β1 and β2) and of salt bridges in stabilizing the aggregates. Residues in β-sheet regions have smaller fluctuation while those at the edge and loop region are more mobile. The inter-peptide salt bridges between Asp23 and Lys28 are strong compared to intra-chain salt bridge and there is an exchange of the inter-chain salt-bridge with intra-chain salt bridge. As our results suggest that Aβ exists under physiological conditions as an ensemble of distinct segmental polymorphs, it may be necessary to account in the development of therapeutics for Alzheimer's disease the differences in structural stability and aggregation behavior of the various Aβ polymorphic forms.
Conflict of interest statement
Figures
Similar articles
-
Assessing the stability of Alzheimer's amyloid protofibrils using molecular dynamics.J Phys Chem B. 2010 Feb 4;114(4):1652-60. doi: 10.1021/jp9110794. J Phys Chem B. 2010. PMID: 20055378
-
Explicit solvent molecular dynamics simulations of Aβ peptide interacting with ibuprofen ligands.J Phys Chem B. 2012 Nov 1;116(43):12922-32. doi: 10.1021/jp306208n. Epub 2012 Oct 18. J Phys Chem B. 2012. PMID: 23051147
-
Amyloid-β peptide structure in aqueous solution varies with fragment size.J Chem Phys. 2011 Nov 28;135(20):205101. doi: 10.1063/1.3662490. J Chem Phys. 2011. PMID: 22128957
-
Exploring the Alzheimer amyloid-β peptide conformational ensemble: A review of molecular dynamics approaches.Peptides. 2015 Jul;69:86-91. doi: 10.1016/j.peptides.2015.04.009. Epub 2015 Apr 20. Peptides. 2015. PMID: 25908410 Review.
-
Molecular simulation of the primary and secondary structures of the Abeta(1-42)-peptide of Alzheimer's disease.Med Res Rev. 1998 Nov;18(6):403-30. doi: 10.1002/(sici)1098-1128(199811)18:6<403::aid-med4>3.0.co;2-c. Med Res Rev. 1998. PMID: 9828040 Review.
Cited by
-
Melatonin: Regulation of Biomolecular Condensates in Neurodegenerative Disorders.Antioxidants (Basel). 2021 Sep 17;10(9):1483. doi: 10.3390/antiox10091483. Antioxidants (Basel). 2021. PMID: 34573116 Free PMC article. Review.
-
Tailoring Hydrophobic Interactions between Probes and Amyloid-β Peptides for Fluorescent Monitoring of Amyloid-β Aggregation.ACS Omega. 2018 May 11;3(5):5141-5154. doi: 10.1021/acsomega.8b00286. eCollection 2018 May 31. ACS Omega. 2018. PMID: 31458729 Free PMC article.
-
Structural Requirement of hA5G18 Peptide (DDFVFYVGGYPS) from Laminin α5 Chain for Amyloid-like Fibril Formation and Cell Adhesion.Molecules. 2022 Oct 5;27(19):6610. doi: 10.3390/molecules27196610. Molecules. 2022. PMID: 36235147 Free PMC article.
-
Side-chain hydrophobicity and the stability of Aβ₁₆₋₂₂ aggregates.Protein Sci. 2012 Dec;21(12):1837-48. doi: 10.1002/pro.2164. Protein Sci. 2012. PMID: 23015407 Free PMC article.
-
Interactions between Aβ and mutated Tau lead to polymorphism and induce aggregation of Aβ-mutated tau oligomeric complexes.PLoS One. 2013 Aug 12;8(8):e73303. doi: 10.1371/journal.pone.0073303. eCollection 2013. PLoS One. 2013. PMID: 23951348 Free PMC article.
References
-
- Hardy J, Selkoe DJ. Medicine - The amyloid hypothesis of Alzheimer’s disease: Progress and problems on the road to therapeutics. Science. 2002;297:353–356. - PubMed
-
- Chiti F, Dobson CM. Protein misfolding, functional amyloid, and human disease. Annual Review of Biochemistry. Palo Alto: Annual Reviews. 2006. pp. 333–366. - PubMed
Publication types
MeSH terms
Substances
Grants and funding
LinkOut - more resources
Full Text Sources
Research Materials
