. 2012;7(7):e41495.
doi: 10.1371/journal.pone.0041495. Epub 2012 Jul 24.

Aldolase B knockdown prevents high glucose-induced methylglyoxal overproduction and cellular dysfunction in endothelial cells

Affiliations

Aldolase B knockdown prevents high glucose-induced methylglyoxal overproduction and cellular dysfunction in endothelial cells

Jianghai Liu et al. PLoS One. 2012.

Abstract

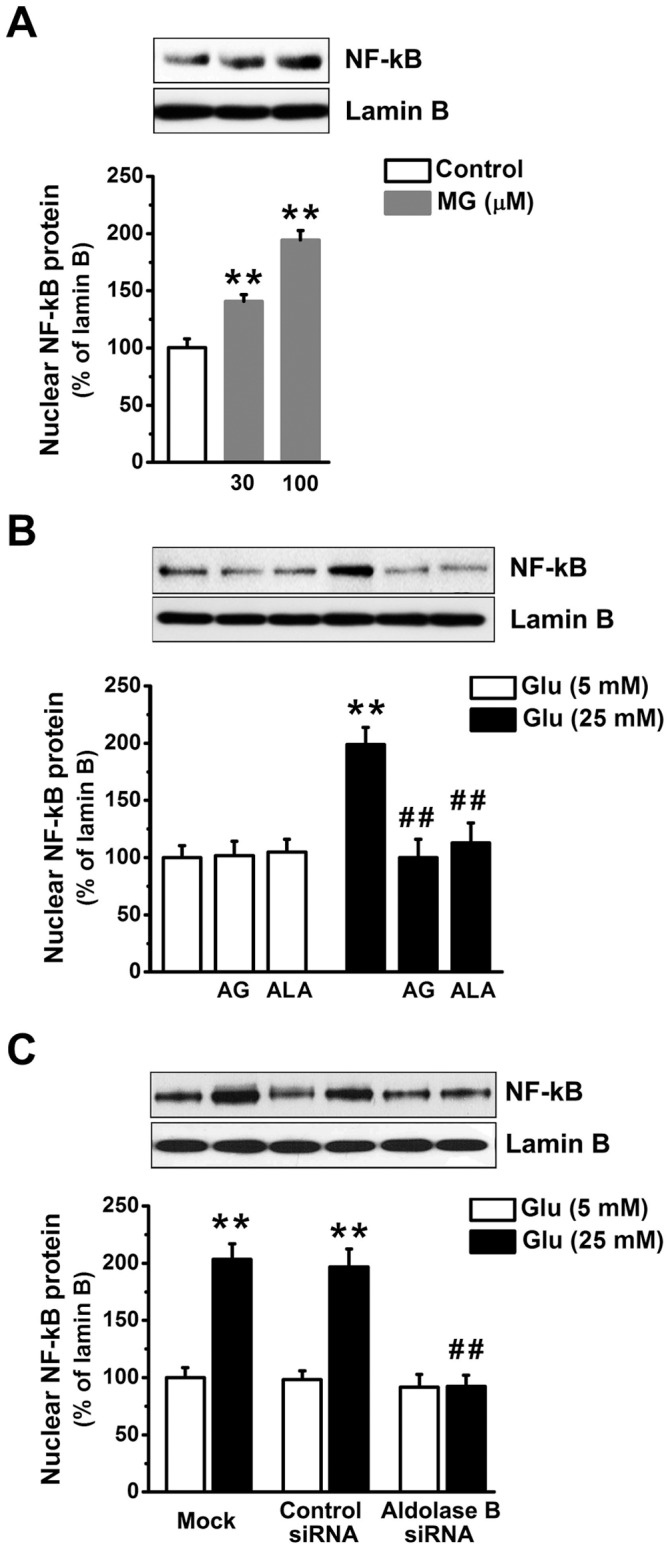
We used cultured endothelial cells as a model to examine whether up-regulation of aldolase B and enhanced methylglyoxal (MG) formation play an important role in high glucose-induced overproduction of advanced glycosylation endproducts (AGEs), oxidative stress and cellular dysfunction. High glucose (25 mM) incubation up-regulated mRNA levels of aldose reductase (an enzyme converting glucose to fructose) and aldolase B (a key enzyme that catalyzes MG formation from fructose) and enhanced MG formation in human umbilical vein endothelial cells (HUVECs) and HUVEC-derived EA. hy926 cells. High glucose-increased MG production in EA. hy926 cells was completely prevented by siRNA knockdown of aldolase B, but unaffected by siRNA knockdown of aldolase A, an enzyme responsible for MG formation during glycolysis. In addition, inhibition of cytochrome P450 2E1 or semicarbazide-sensitive amine oxidase which produces MG during the metabolism of lipid and proteins, respectively, did not alter MG production. Both high glucose (25 mM) and MG (30, 100 µM) increased the formation of N(ε)-carboxyethyl-lysine (CEL, a MG-induced AGE), oxidative stress (determined by the generation of oxidized DCF, H(2)O(2), protein carbonyls and 8-oxo-dG), O-GlcNAc modification (product of the hexosamine pathway), membrane protein kinase C activity and nuclear translocation of NF-κB in EA. hy926 cells. However, the above metabolic and signaling alterations induced by high glucose were completely prevented by knockdown of aldolase B and partially by application of aminoguanidine (a MG scavenger) or alagebrium (an AGEs breaker). In conclusion, efficient inhibition of aldolase B can prevent high glucose-induced overproduction of MG and related cellular dysfunction in endothelial cells.


Conflict of interest statement

Competing Interests: The authors have declared that no competing interests exist.

Figures

Figure 1
Figure 1. Knockdown of aldolase B prevented MG overproduction in high glucose-treated EA. hy926 cells.
Real-time PCR analysis of aldose reductase and aldolase B expression (A, C) and MG levels (B, D) in human umbilical vein endothelial cells (HUVECs) (A, B) and EA. hy926 cells (C, D) treated with glucose (Glu) in the presence or absence of aminoguanidine (AG, 1 mM) and alagebrium (ALA, 100 µM) for 3 days. **P<0.01 vs. 5 mM glucose; ## P<0.01 vs. 25 mM glucose. Levels of aldolase B mRNA (E) and levels of MG (F) in wide-type cells (WT) and cells transfected with control or aldolase B siRNA, or only transfection agent (Mock). **P<0.01 vs. 5 mM glucose; ## P<0.01 vs. control siRNA.
Figure 2
Figure 2. Knockdown of aldolase B prevented AGEs overproduction in high glucose-treated EA. hy926 cells.
Levels of MG (A) and N(ε)-carboxyethyl-lysine (CEL) in green (B) in cells treated with exogenous MG for 3 days. **P<0.01 vs. control (5 mM glucose). (C) CEL levels in cells treated with glucose (Glu) in the presence or absence of aminoguanidine (AG, 1 mM) and alagebrium (ALA, 100 µM) for 3 days. *P<0.05, **P<0.01 vs. 5 mM glucose; ## P<0.01 vs. 25 mM glucose. (D) CEL levels in cells transfected with control or aldolase B siRNA, or only transfection agent (mock). **P<0.01 vs. 5 mM glucose; ## P<0.01 vs. control siRNA. Nuclear DNA (red) was stained with propidium iodide (PI). The summary of fluorescence intensity of CEL was measured using Image J.
Figure 3
Figure 3. Knockdown of aldolase B prevented the increase of oxidized DCF and H2O2 levels in high glucose-treated EA. hy926 cells.
Levels of oxidized DCF (A) in cells treated with exogenous MG (**P<0.01 vs. control), (B) in cells treated with glucose in the presence or absence of aminoguanidine (AG, 1 mM) and alagebrium (ALA, 100 µM) (*P<0.05, **P<0.01 vs. 5 mM glucose; ## P<0.01 vs. 25 mM glucose), and (C) in cells transfected with control or aldolase B siRNA, or only transfection agent (mock) (*P<0.05, **P<0.01 vs. 5 mM glucose; ## P<0.01 vs. control siRNA). Levels of H2O2 (D) in cells treated with exogenous MG (*P<0.05, **P<0.01 vs. control), (E) in cells treated with glucose in the presence or absence of aminoguanidine (AG, 1 mM) and alagebrium (ALA, 100 µM) (**P<0.01 vs. 5 mM glucose; ## P<0.01 vs. 25 mM glucose), and (F) in cells transfected with control or aldolase B siRNA, or only transfection agent (mock) (**P<0.01 vs. 5 mM glucose; ## P<0.01 vs. control siRNA).
Figure 4
Figure 4. Knockdown of aldolase B prevented protein and DNA oxidation in high glucose-treated EA. hy926 cells.
Levels of protein carbonyls (A) in cells treated with exogenous MG (**P<0.01 vs. control), (B) in cells treated with glucose in the presence or absence of aminoguanidine (AG, 1 mM) and alagebrium (ALA, 100 µM) (*P<0.05, **P<0.01 vs. 5 mM glucose; ## P<0.01 vs. 25 mM glucose), and (C) in cells transfected with control or aldolase B siRNA, or only transfection agent (mock) (**P<0.01 vs. 5 mM glucose; ## P<0.01 vs. control siRNA). Levels of 8-oxo-dG (D) in cells treated with exogenous MG (**P<0.01 vs. control), (E) in cells treated with glucose in the presence or absence of aminoguanidine (AG, 1 mM) and alagebrium (ALA, 100 µM) (*P<0.05, **P<0.01 vs. 5 mM glucose; ## P<0.01 vs. 25 mM glucose), and (F) in cells transfected with control or aldolase B siRNA, or only transfection agent (mock) (**P<0.01 vs. 5 mM glucose; ## P<0.01 vs. control siRNA). Fluorescence intensity of 8-oxo-dG per cell was measured using Image J.
Figure 5
Figure 5. Knockdown of aldolase B prevented high glucose-increased O-linked N-acetyl glucosamine (O-GlcNAc) modification in EA. hy926 cells.
(A) O-GlcNAc modification of total cellular proteins in cells treated with exogenous MG for 3 days. **P<0.01 vs. control (5 mM glucose). (B) O-GlcNAc modification of total cellular proteins in cells treated with glucose (Glu) in the presence or absence of aminoguanidine (AG, 1 mM) and alagebrium (ALA, 100 µM). *P<0.05, **P<0.01 vs. 5 mM glucose; ## P<0.01 vs. 25 mM glucose. (C) O-GlcNAc modification of total cellular proteins in cells transfected with control or aldolase B siRNA, or only transfection agent (mock). **P<0.01 vs. 5 mM glucose; ## P<0.01 vs. control siRNA.
Figure 6
Figure 6. Knockdown of aldolase B prevented high glucose-increased membrane protein kinase C (PKC) activities in EA. hy926 cells.
(A) Membrane PKC activities in cells treated with exogenous MG for 3 days. **P<0.01 vs. control (5 mM glucose). (B) Membrane PKC activities in cells treated with glucose (Glu) in the presence or absence of aminoguanidine (AG, 1 mM) and alagebrium (ALA, 100 µM). *P<0.05, **P<0.01 vs. 5 mM glucose; ## P<0.01 vs. 25 mM glucose. (C) Membrane PKC activities in cells transfected with control or aldolase B siRNA, or only transfection agent (mock). **P<0.01 vs. 5 mM glucose; ## P<0.01 vs. control siRNA.
Figure 7
Figure 7. Knockdown of aldolase B prevented high glucose-increased NF-κB nuclear translocation in EA. hy926 cells.
(A) Nuclear p65 subunit of NF-κB in cells treated with exogenous MG for 3 days. **P<0.01 vs. control (5 mM glucose). (B) Nuclear p65 subunit of NF-κB in cells treated with glucose (Glu) in the presence or absence of aminoguanidine (AG, 1 mM) and alagebrium (ALA, 100 µM). **P<0.01 vs. 5 mM glucose; ## P<0.01 vs. 25 mM glucose. (C) Nuclear p65 subunit of NF-κB in cells transfected with control or aldolase B siRNA, or only transfection agent (mock). **P<0.01 vs. 5 mM glucose; ## P<0.01 vs. control siRNA.

References

    1. Brownlee M. Biochemistry and molecular cell biology of diabetic complications. Nature. 2001;414:813–820. - PubMed
    1. Hanssen KF. Blood glucose control and microvascular and macrovascular complications in diabetes. Diabetes. 1997;46:S101–103. - PubMed
    1. Scalia R, Gong Y, Berzins B, Zhao LJ, Sharma K. Hyperglycemia is a major determinant of albumin permeability in diabetic microcirculation: the role of mu-calpain. Diabetes. 2007;56:1842–1849. - PubMed
    1. Han J, Mandal AK, Hiebert LM. Endothelial cell injury by high glucose and heparanase is prevented by insulin, heparin and basic fibroblast growth factor. Cardiovasc Diabetol. 2005;4:12. - PMC - PubMed
    1. Schalkwijk CG, Stehouwer CD. Vascular complications in diabetes mellitus: the role of endothelial dysfunction. Clin Sci (Lond) 2005;109:143–159. - PubMed

Publication types

MeSH terms