

Associations of fatty acids in cerebrospinal fluid with peripheral glucose concentrations and energy metabolism
- PMID: 22911803
- PMCID: PMC3404019
- DOI: 10.1371/journal.pone.0041503
Associations of fatty acids in cerebrospinal fluid with peripheral glucose concentrations and energy metabolism
Abstract
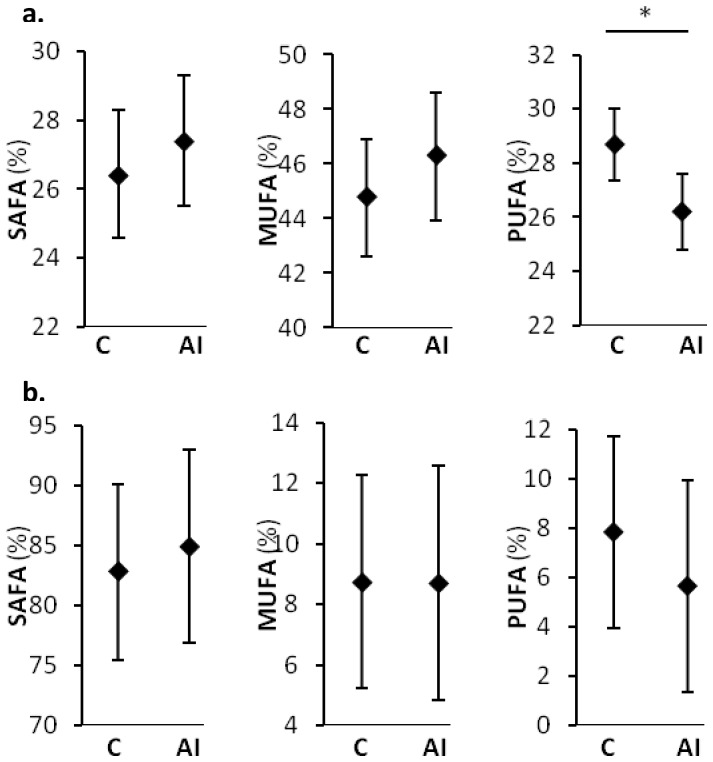
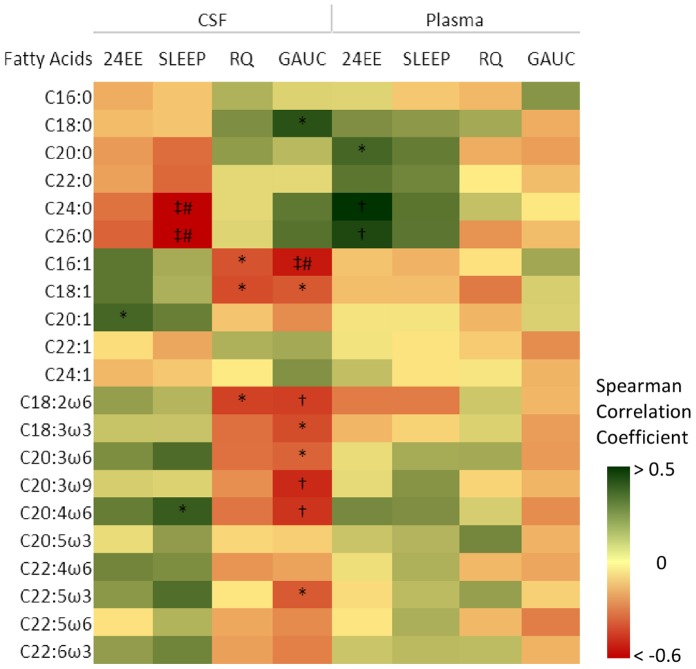
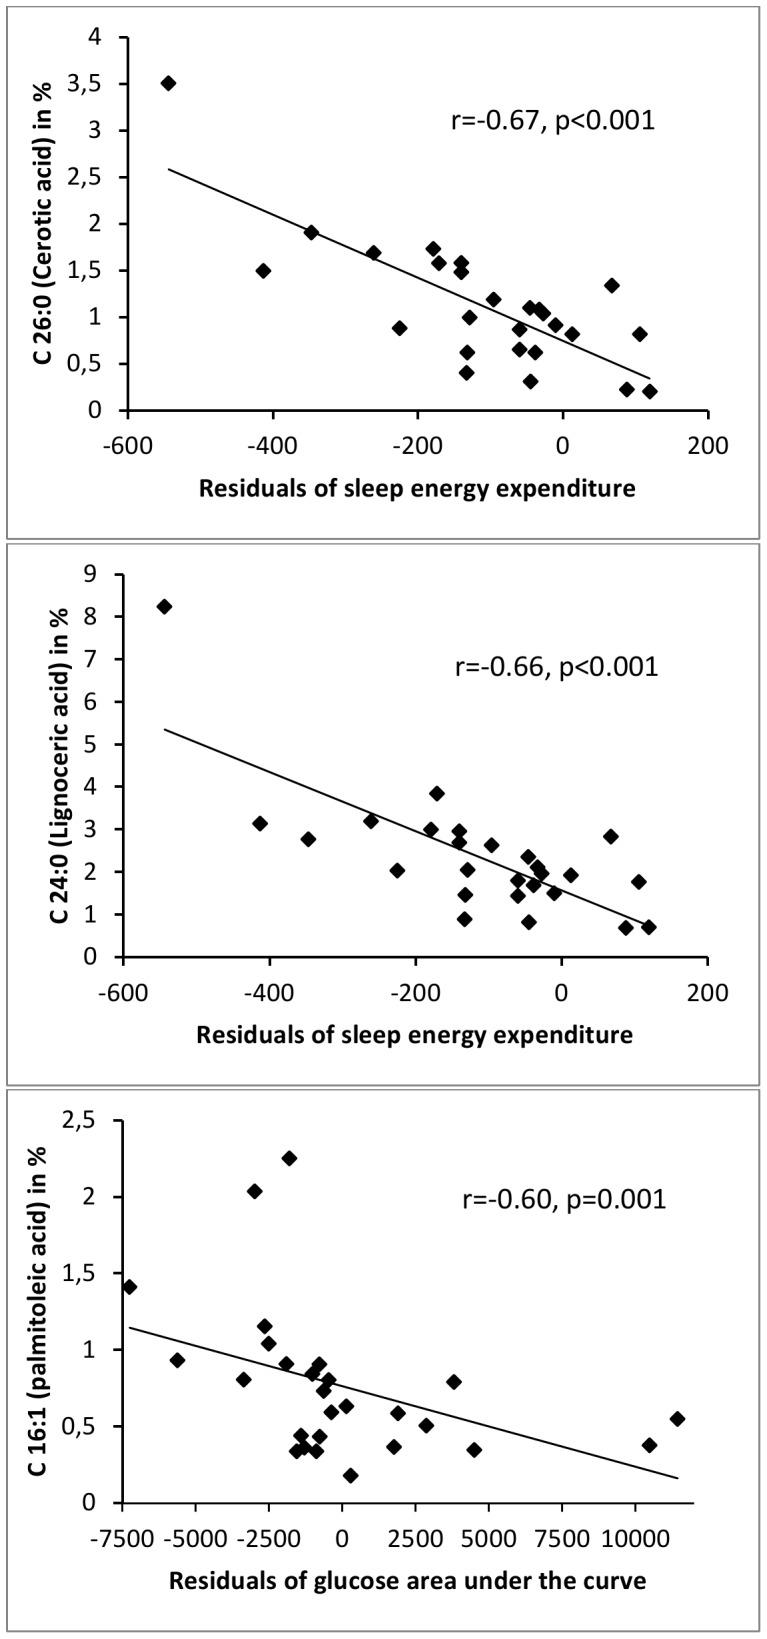
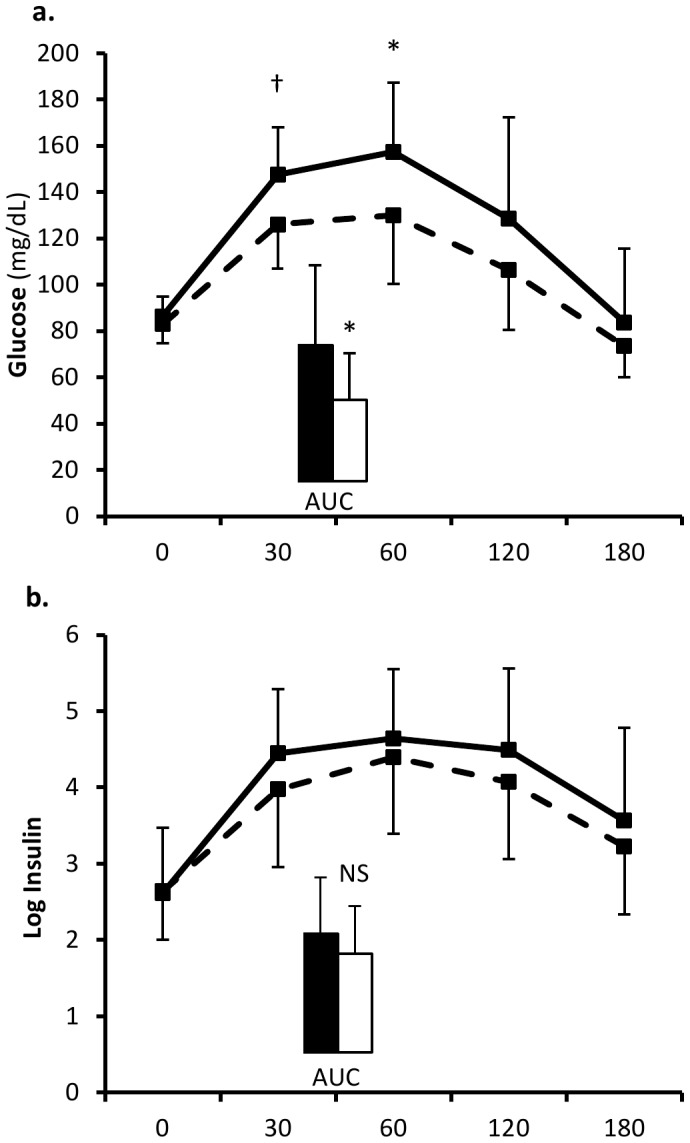
Rodent experiments have emphasized a role of central fatty acid (FA) species, such as oleic acid, in regulating peripheral glucose and energy metabolism. Thus, we hypothesized that central FAs are related to peripheral glucose regulation and energy expenditure in humans. To test this we measured FA species profiles in cerebrospinal fluid (CSF) and plasma of 32 individuals who stayed in our clinical inpatient unit for 6 days. Body composition was measured by dual energy X-ray absorptiometry and glucose regulation by an oral glucose test (OGTT) followed by measurements of 24 hour (24EE) and sleep energy expenditure (SLEEP) as well as respiratory quotient (RQ) in a respiratory chamber. CSF was obtained via lumbar punctures; FA concentrations were measured by liquid chromatography/mass spectrometry. As expected, FA concentrations were higher in plasma compared to CSF. Individuals with high concentrations of CSF very-long-chain saturated FAs had lower rates of SLEEP. In the plasma moderate associations of these FAs with higher 24EE were observed. Moreover, CSF monounsaturated long-chain FA (palmitoleic and oleic acid) concentrations were associated with lower RQs and lower glucose area under the curve during the OGTT. Thus, FAs in the CSF strongly correlated with peripheral metabolic traits. These physiological parameters were most specific to long-chain monounsaturated (C16:1, C18:1) and very-long-chain saturated (C24:0, C26:0) FAs.
Conclusions: Together with previous animal experiments these initial cross-sectional human data indicate that central FA species are linked to peripheral glucose and energy homeostasis.
Conflict of interest statement
Figures
References
-
- Das UN. Essential fatty acids: biochemistry, physiology and pathology. Biotechnol J. 2006;1:420–439. - PubMed
-
- Warensjo E, Riserus U, Vessby B. Fatty acid composition of serum lipids predicts the development of the metabolic syndrome in men. Diabetologia. 2005;48:1999–2005. - PubMed
-
- Warensjo E, Ohrvall M, Vessby B. Fatty acid composition and estimated desaturase activities are associated with obesity and lifestyle variables in men and women. Nutr Metab Cardiovasc Dis. 2006;16:128–136. - PubMed
Publication types
MeSH terms
Substances
Grants and funding
LinkOut - more resources
Full Text Sources
Medical
Research Materials
Miscellaneous
