

Gene regulatory networks controlling hematopoietic progenitor niche cell production and differentiation in the Drosophila lymph gland
- PMID: 22911822
- PMCID: PMC3404040
- DOI: 10.1371/journal.pone.0041604
Gene regulatory networks controlling hematopoietic progenitor niche cell production and differentiation in the Drosophila lymph gland
Erratum in
-
Correction: Gene Regulatory Networks Controlling Hematopoietic Progenitor Niche Cell Production and Differentiation in the Drosophila Lymph Gland.PLoS One. 2013 Mar 4;8(3):10.1371/annotation/f9660803-198b-4d0d-8200-719a2eb2a443. doi: 10.1371/annotation/f9660803-198b-4d0d-8200-719a2eb2a443. eCollection 2013. PLoS One. 2013. PMID: 29364976 Free PMC article.
Abstract
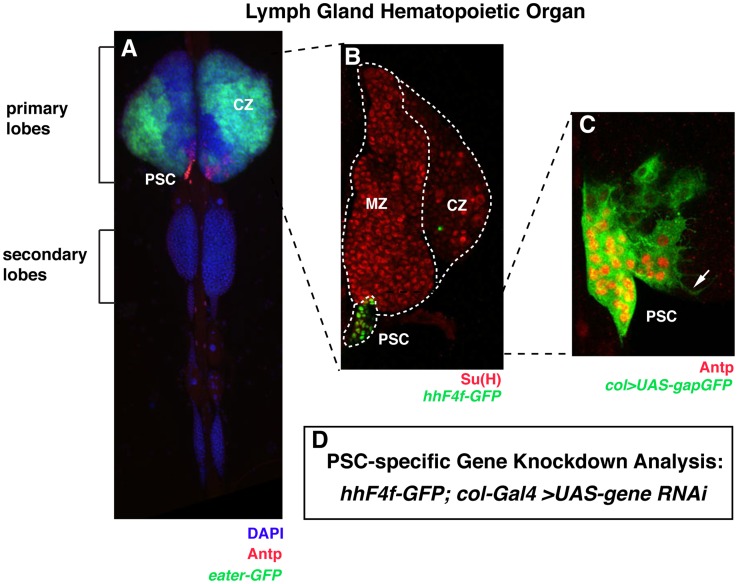
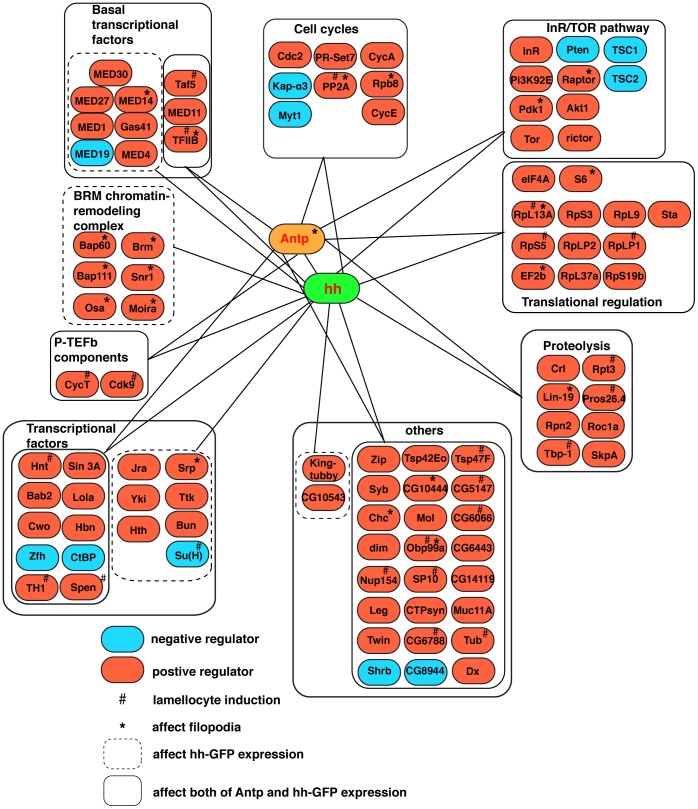
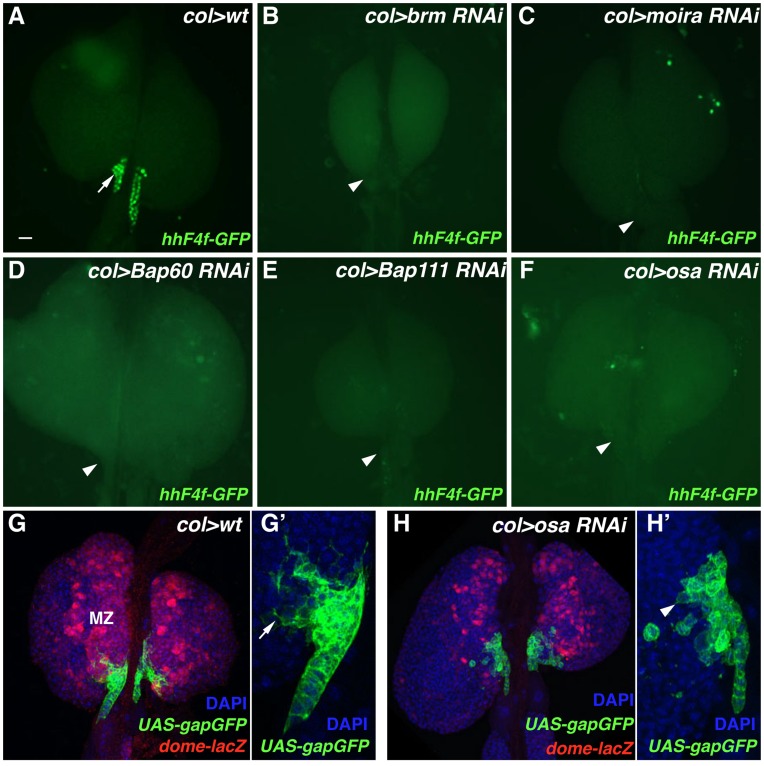
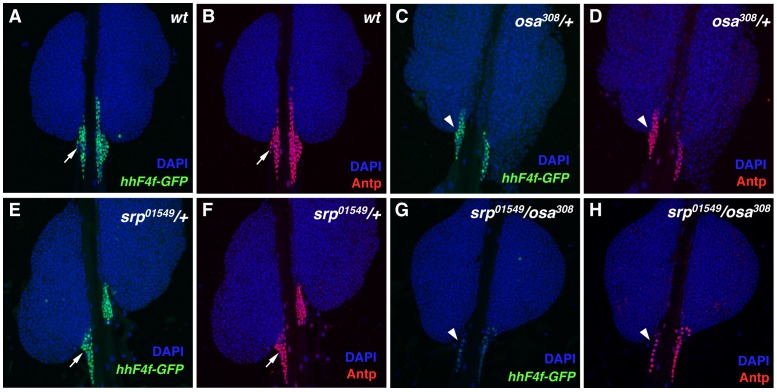
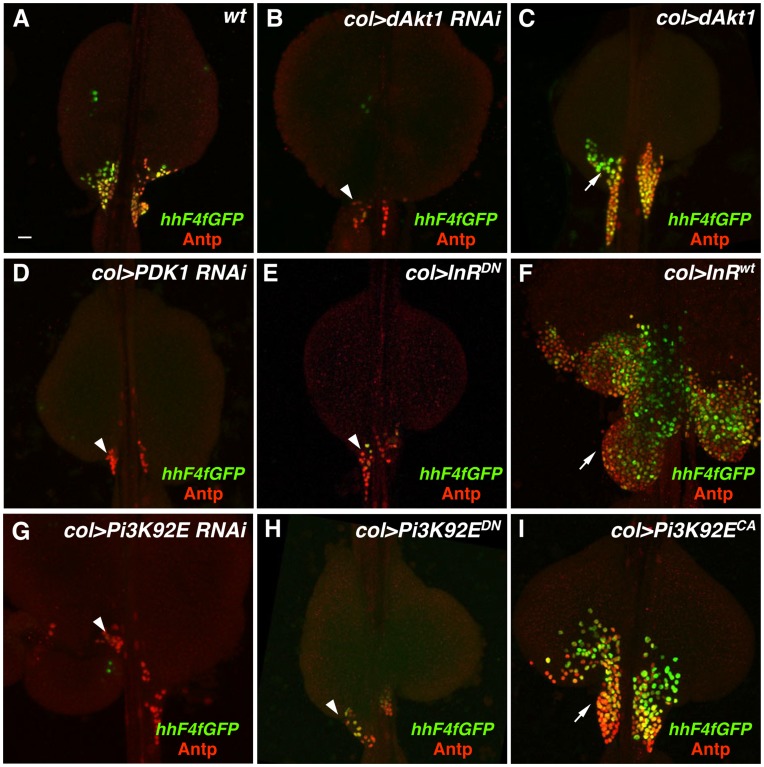
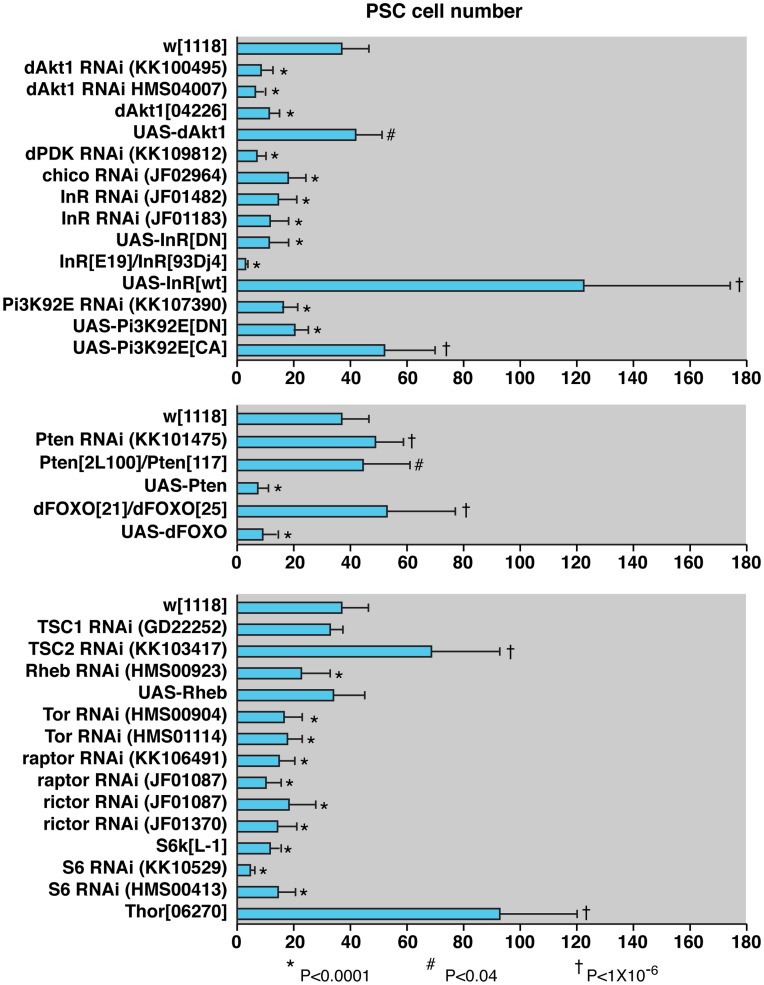
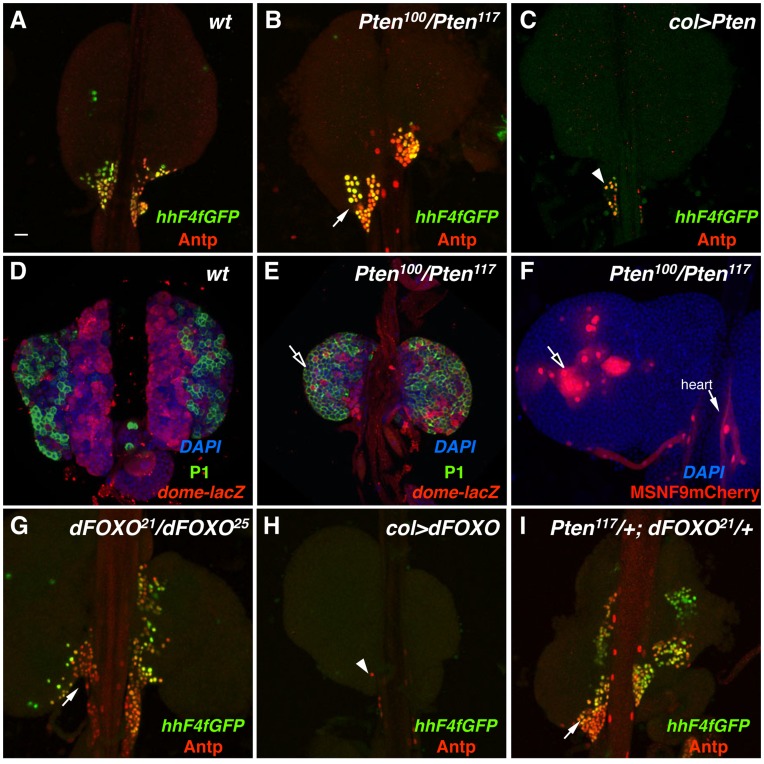
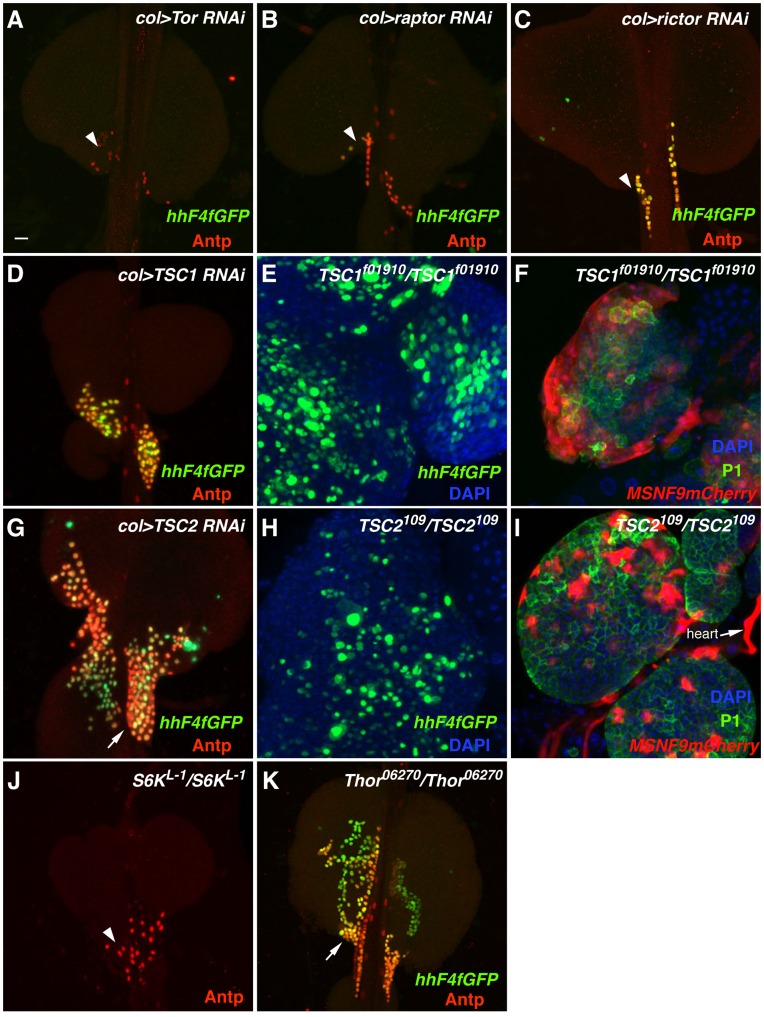
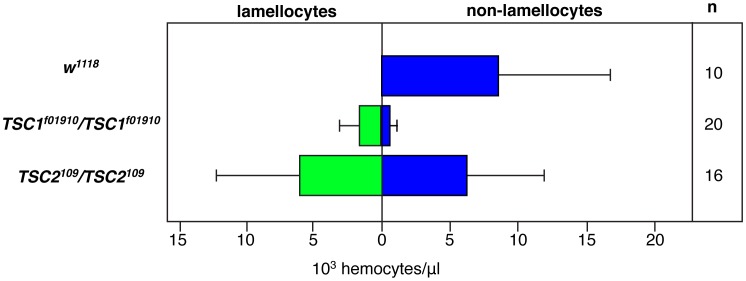
Hematopoiesis occurs in two phases in Drosophila, with the first completed during embryogenesis and the second accomplished during larval development. The lymph gland serves as the venue for the final hematopoietic program, with this larval tissue well-studied as to its cellular organization and genetic regulation. While the medullary zone contains stem-like hematopoietic progenitors, the posterior signaling center (PSC) functions as a niche microenvironment essential for controlling the decision between progenitor maintenance versus cellular differentiation. In this report, we utilize a PSC-specific GAL4 driver and UAS-gene RNAi strains, to selectively knockdown individual gene functions in PSC cells. We assessed the effect of abrogating the function of 820 genes as to their requirement for niche cell production and differentiation. 100 genes were shown to be essential for normal niche development, with various loci placed into sub-groups based on the functions of their encoded protein products and known genetic interactions. For members of three of these groups, we characterized loss- and gain-of-function phenotypes. Gene function knockdown of members of the BAP chromatin-remodeling complex resulted in niche cells that do not express the hedgehog (hh) gene and fail to differentiate filopodia believed important for Hh signaling from the niche to progenitors. Abrogating gene function of various members of the insulin-like growth factor and TOR signaling pathways resulted in anomalous PSC cell production, leading to a defective niche organization. Further analysis of the Pten, TSC1, and TSC2 tumor suppressor genes demonstrated their loss-of-function condition resulted in severely altered blood cell homeostasis, including the abundant production of lamellocytes, specialized hemocytes involved in innate immune responses. Together, this cell-specific RNAi knockdown survey and mutant phenotype analyses identified multiple genes and their regulatory networks required for the normal organization and function of the hematopoietic progenitor niche within the lymph gland.
Conflict of interest statement
Figures
Similar articles
-
Serpent, suppressor of hairless and U-shaped are crucial regulators of hedgehog niche expression and prohemocyte maintenance during Drosophila larval hematopoiesis.Development. 2010 Nov;137(21):3561-8. doi: 10.1242/dev.053728. Epub 2010 Sep 28. Development. 2010. PMID: 20876645 Free PMC article.
-
The EBF transcription factor Collier directly promotes Drosophila blood cell progenitor maintenance independently of the niche.Proc Natl Acad Sci U S A. 2015 Jul 21;112(29):9052-7. doi: 10.1073/pnas.1423967112. Epub 2015 Jul 6. Proc Natl Acad Sci U S A. 2015. PMID: 26150488 Free PMC article.
-
Bag of Marbles controls the size and organization of the Drosophila hematopoietic niche through interactions with the Insulin-like growth factor pathway and Retinoblastoma-family protein.Development. 2015 Jul 1;142(13):2261-7. doi: 10.1242/dev.121798. Epub 2015 Jun 3. Development. 2015. PMID: 26041767
-
Drosophila as a Model to Study Cellular Communication Between the Hematopoietic Niche and Blood Progenitors Under Homeostatic Conditions and in Response to an Immune Stress.Front Immunol. 2021 Aug 16;12:719349. doi: 10.3389/fimmu.2021.719349. eCollection 2021. Front Immunol. 2021. PMID: 34484226 Free PMC article. Review.
-
The Drosophila lymph gland is an ideal model for studying hematopoiesis.Dev Comp Immunol. 2018 Jun;83:60-69. doi: 10.1016/j.dci.2017.11.017. Epub 2017 Nov 27. Dev Comp Immunol. 2018. PMID: 29191551 Review.
Cited by
-
The Posterior Signaling Center Is an Important Microenvironment for Homeostasis of the Drosophila Lymph Gland.Front Cell Dev Biol. 2020 May 21;8:382. doi: 10.3389/fcell.2020.00382. eCollection 2020. Front Cell Dev Biol. 2020. PMID: 32509789 Free PMC article. Review.
-
Blood cell progenitor maintenance: Collier barks out of the niche.Fly (Austin). 2015;9(4):160-4. doi: 10.1080/19336934.2016.1151130. Fly (Austin). 2015. PMID: 26925971 Free PMC article.
-
Smoothened Inhibitor, PF-04449913 Inhibits the Development of Myelofibrosis in a JAK2V617F Transgenic Mouse Model by Reducing TGF-β and MAPK Signaling Pathways.Res Sq [Preprint]. 2025 May 9:rs.3.rs-6580439. doi: 10.21203/rs.3.rs-6580439/v1. Res Sq. 2025. PMID: 40386398 Free PMC article. Preprint.
-
Harnessing the natural Drosophila-parasitoid model for integrating insect immunity with functional venomics.Curr Opin Insect Sci. 2014 Dec 1;6:61-67. doi: 10.1016/j.cois.2014.09.016. Curr Opin Insect Sci. 2014. PMID: 25642411 Free PMC article.
-
Two Independent Functions of Collier/Early B Cell Factor in the Control of Drosophila Blood Cell Homeostasis.PLoS One. 2016 Feb 11;11(2):e0148978. doi: 10.1371/journal.pone.0148978. eCollection 2016. PLoS One. 2016. PMID: 26866694 Free PMC article.
References
Publication types
MeSH terms
Substances
Grants and funding
LinkOut - more resources
Full Text Sources
Medical
Molecular Biology Databases
Research Materials
Miscellaneous
