. 2012 Oct 12;111(9):1125-36.
doi: 10.1161/CIRCRESAHA.112.273144. Epub 2012 Aug 21.

Extracellular matrix promotes highly efficient cardiac differentiation of human pluripotent stem cells: the matrix sandwich method

Affiliations

Extracellular matrix promotes highly efficient cardiac differentiation of human pluripotent stem cells: the matrix sandwich method

Jianhua Zhang et al. Circ Res. .

Abstract

Rationale: Cardiomyocytes (CMs) differentiated from human pluripotent stem cells (PSCs) are increasingly being used for cardiovascular research, including disease modeling, and hold promise for clinical applications. Current cardiac differentiation protocols exhibit variable success across different PSC lines and are primarily based on the application of growth factors. However, extracellular matrix is also fundamentally involved in cardiac development from the earliest morphogenetic events, such as gastrulation.

Objective: We sought to develop a more effective protocol for cardiac differentiation of human PSCs by using extracellular matrix in combination with growth factors known to promote cardiogenesis.

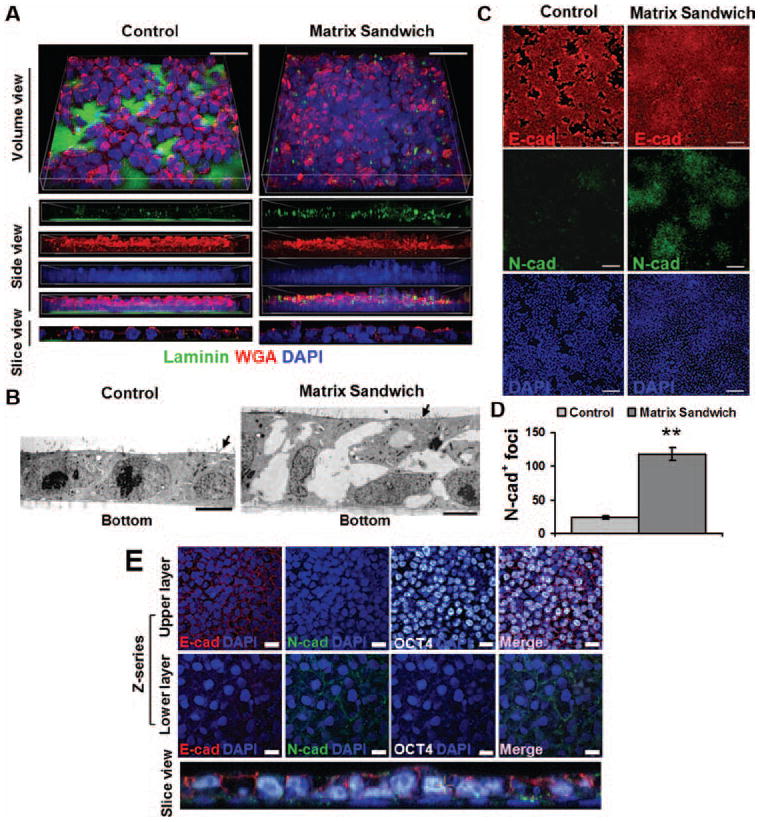
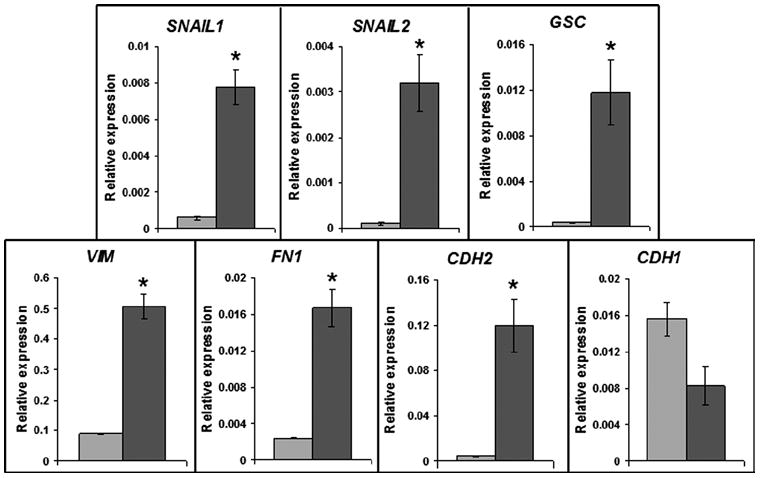
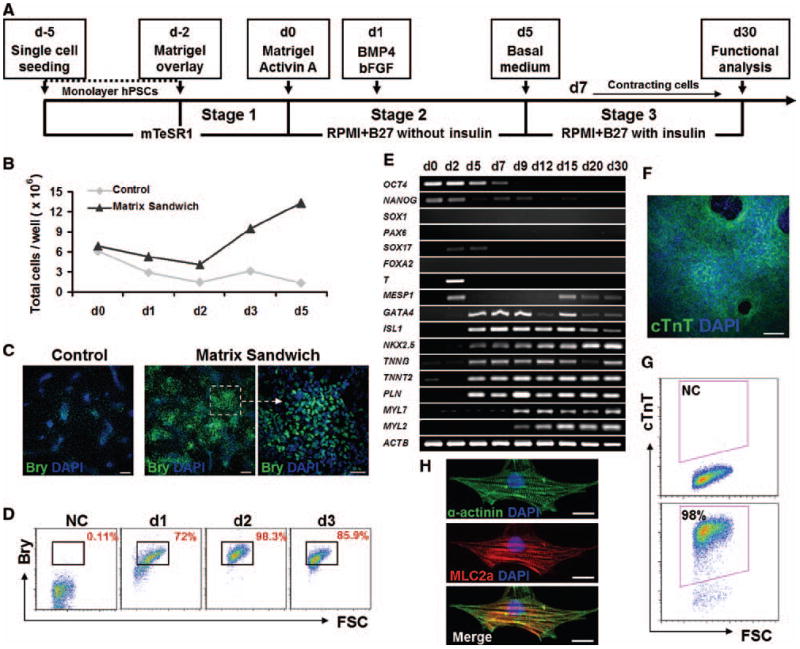
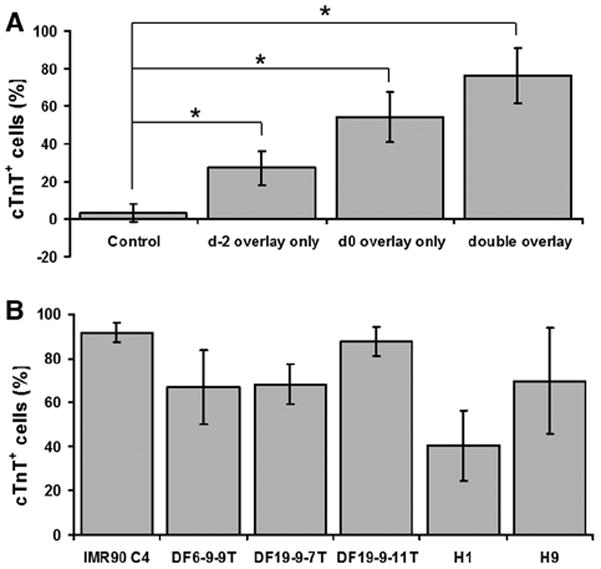
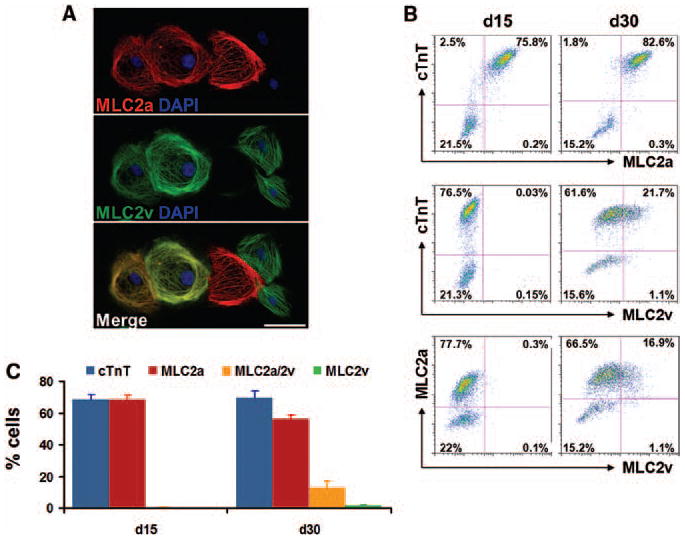
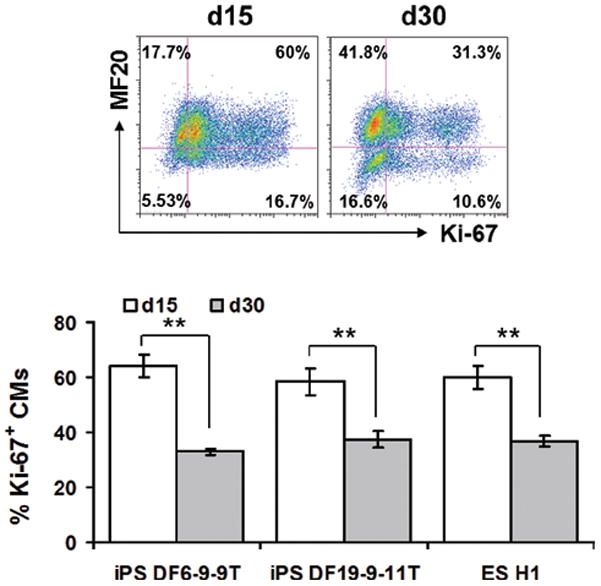
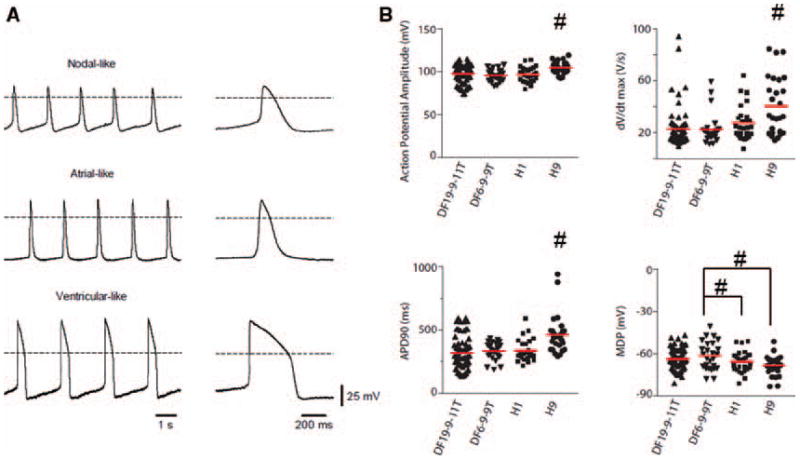
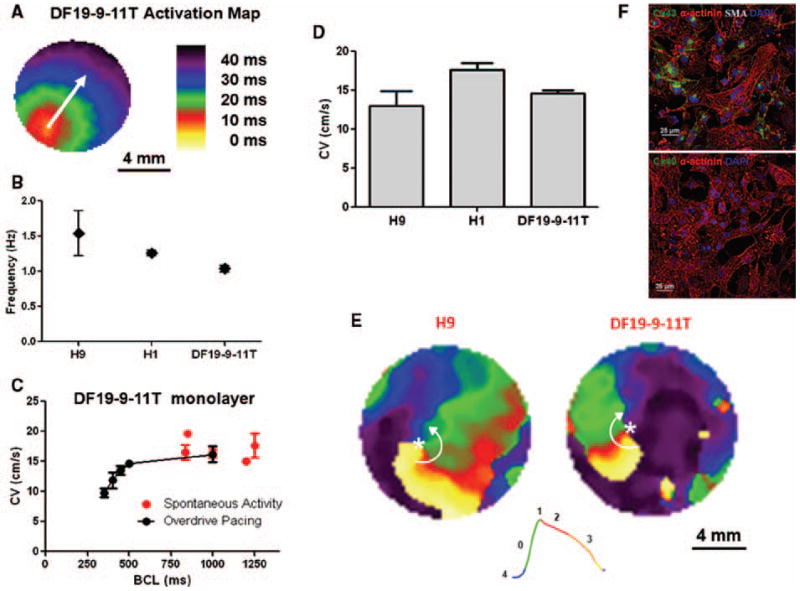
Methods and results: PSCs were cultured as monolayers on Matrigel, an extracellular matrix preparation, and subsequently overlayed with Matrigel. The matrix sandwich promoted an epithelial-to-mesenchymal transition as in gastrulation with the generation of N-cadherin-positive mesenchymal cells. Combining the matrix sandwich with sequential application of growth factors (Activin A, bone morphogenetic protein 4, and basic fibroblast growth factor) generated CMs with high purity (up to 98%) and yield (up to 11 CMs/input PSC) from multiple PSC lines. The resulting CMs progressively matured over 30 days in culture based on myofilament expression pattern and mitotic activity. Action potentials typical of embryonic nodal, atrial, and ventricular CMs were observed, and monolayers of electrically coupled CMs modeled cardiac tissue and basic arrhythmia mechanisms.

Conclusions: Dynamic extracellular matrix application promoted epithelial-mesenchymal transition of human PSCs and complemented growth factor signaling to enable robust cardiac differentiation.


Figures

Figure 1
Figure 1. Extracellular matrix overlay promotes epithelial-mesenchymal transition of human PSCs
(A) Confocal imaging of iPSCs (DF19-9-11T) seeded as single cells on Matrigel coated surface and propagated in mTeSR1 for 4 days without Matrigel overlay (Control) or with a Matrigel overlay (Matrix Sandwich) for the last 24 hours. 3D reconstructed z-series of images labeled with an antibody to laminin, fluorescent-conjugated WGA for glycoproteins, and DAPI for nuclei. Scale bars are 20 μm. (B) Electron micrographs of control cultures demonstrate confluent monolayers compared to matrix sandwich cultures which are multilayered with an upper epithelial layer and mesenchymal cells below. Arrows indicate microvilli. Scale bars are 5 μm. (C) Epifluorescence images of control and matrix sandwich cell culture 24 hours after Matrigel overlay immunolabeled with E-cadherin and N-cadherin antibodies. Scale bars are 100 μm. (D) Comparison of average number of N-cadherin+ foci (per 1.8 cm2 surface area) in control and matrix sandwich cell cultures (DF19-9-11T). Error bars represent SEM, N=3. Data were compared using Student’s t-test with ** indicating significantly different, P < 0.01. (E) Confocal images of the multilayered areas in the matrix sandwich culture as described in (A) immunolabeled for E-cadherin, N-cadherin, and Oct4. DAPI identifies nuclei. The bottom panel shows a slice view reconstructed from the z-series highlighting the different cell layers. Scale bars are 20 μm.
Figure 2
Figure 2. Quantitative RT-PCR of EMT-related gene expression in control and matrix sandwich culture (DF19-9-11T)
Light grey bars are the control and dark grey bars are the matrix sandwich culture. Total RNA was isolated from monolayer and matrix sandwich culture 48 hours after Matrigel overlay. The relative gene expression was analyzed from three replicates and normalized to the endogenous β-actin. Error bars represent SEM, N=3. Data were compared using Student’s t-test with * indicating significantly different, P < 0.05.
Figure 3
Figure 3. Matrix sandwich method for efficient cardiogenesis of iPSC line DF19-9-11T
(A) Schematic of the matrix sandwich protocol. (B) Total cells present per 35 mm well of the control (without Matrigel overlay) or the matrix sandwich culture for days 0 to 5 with Activin A (100 ng/ml) added on d0 followed by BMP4 (10 ng/ml) and bFGF (5 ng/ml) added on d1–d5. Data from one experiment are shown which are representative of 4 experiments. (C) Fluorescence images of day 2 cells differentiated using the protocol defined in (A) of the Control (without Matrigel overlay) or the Matrix sandwich culture immunolabeled with Brachyury (Bry) antibody. Scale bars are 200 μm for the left and middle panel, 50 μm for the right panel. (D) Quantification of Brachyury+ cells at day 1, 2 and 3 by flow cytometry. NC indicates negative control of the cell sample without primary antibody. (E) RT-PCR analysis of gene expression of matrix sandwich differentiated cells over 30 days of differentiation. (F) Immunofluorescence image of day 15 matrix sandwich culture identifying cTnT with DAPI for nuclei. Scale bar is 100 μm. (G) Flow cytometry of cells from matrix sandwich culture for cTnT at 30 days differentiation, NC shows the negative control with secondary antibody only. (H) Epifluorescence images of single CM isolated from the matrix sandwich culture shows sarcomeric organization. Re-plated CMs from the matrix sandwich culture were co-labeled with anti-α-actinin antibody which marks the Z-lines and anti-MLC2a antibody that shows the A-bands in the sarcomere. Scale bars are 20 μm.
Figure 4
Figure 4. ECM requirements for matrix sandwich protocol-based cardiac differentiation and robust application to multiple hPSC lines
(A) Effect of single or double Matrigel overlays on cardiac differentiation using the protocol defined in Figure 3(A) with Activin A (100 ng/ml), BMP4 (10 ng/ml) and bFGF (5 ng/ml). Cardiogenesis efficiency was measured by flow cytometry for cTnT+ CMs at 15 days differentiation of the iPSC line DF19-9-11T. Control is the cell culture without Matrigel overlay. Error bars represent SD, N=9. (B) Cardiac differentiation of multiple hPSC lines assessed by flow cytometry for cTnT at 15 days differentiaton using the matrix sandwich protocol. Error bars represent SD, N=15 for IMR90 C4; N=15 for DF6-9-9T; N=13 for DF19-9-7T; N=21 for DF19-9-11T; N=24 for H1; N=16 for H9. Data were compared using one-way ANOVA with * indicating significantly different, P < 0.05.
Figure 5
Figure 5. Expression pattern of myosin light chain 2 isoforms, MLC2a and MLC2v, during cardiac differentiation of hPSCs using matrix sandwich protocol
(A) Co-labeling of the re-plated CMs from matrix sandwich culture after 30 days differentiation of iPSCs (DF19-9-11T) with MLC2a and MLC2v antibodies. Scale bar is 50 μm. (B) Dot plots of flow cytometry analysis of cells after 15 and 30 days differentiation of the iPSCs (DF19-9-11T) for expression of cardiac myofilament proteins cTnT, MLC2a and MLC2v. (C) Average of the percentage of cells expressing cTnT; MLC2a (without MLC2v); MLC2a and MLC2v; and MLC2v (without MLC2a) measured by flow cytometry at 15 and 30 days differentiation of the iPSCs (DF19-9-11T). Error bars represent SEM, N=3. Isotype controls were performed for each antibody combination used in the flow cytometry, data not shown.
Figure 6
Figure 6. Proliferation of human PSC-derived cardiomyocytes in the matrix sandwich culture
Top panel shows the dot plots of flow cytometry of cells after 15 and 30 days differentiation of iPSCs (DF19-9-11T) labeled with MF20 and Ki-67 antibodies. Bottom panel shows the average of the percentage of Ki-67+ CMs measured by flow cytometry at 15 and 30 days differentiation in multiple cell lines. Error bars represent SEM, N=10 for DF6-9-9T; N=10 for DF19-9-11T; N=8 for H1. Data were compared using Student’s t-test with ** indicating significantly different, P < 0.01.
Figure 7
Figure 7. Electrophysiology properties of human PSC-derived cardiomyocytes from matrix sandwich culture
(A) Representative sharp microelectrode recordings of nodal-, atrial-, and ventricular-like action potentials from CMs differentiated from the iPSCs (DF19-9-11T). Dotted line indicates 0 mV. Right, Single action potentials at an expanded timescale taken from traces on the left. (B) Comparison of action potential properties measured from CMs differentiated using the matrix sandwich protocol. Solid lines through distributions indicate population means. Data were compared using one-way ANOVA with # indicating significantly different from all other cell lines or from cell lines indicated, P < 0.05.
Figure 8
Figure 8. Optical mapping of transmembrane voltage from monolayer cultures of PSC-derived CMs
(A) Activation map showing uniform action potential propagation across the monolayer. (B) Spontaneous activation rate for H9, H1, and the DF19-9-11T monolayers. The spontaneous activation rates were 1.54 ± 0.32 (H9, N=8), 1.26 ± 0.04 (H1, N=6), and 1.04 ±0.17 Hz (DF19-9-11T, N=13). (C) Spontaneous and average conduction velocities of the DF19-9-11T cell line measured as a function of pacing frequency (basic cycle length, BCL): Spontaneous (N=13); BCL 1000 (N=5); BCL 500 (N=5); BCL 450 (N =5); BCL 400 (N=5); BCL 350 (N=5). (D) Average conduction velocities for the H9 (N=3), H1 (N=6), and DF19-9-11T (N=5) monolayers measured at 2 Hz pacing. (E) Representative snapshots from phase movies showing electrical rotors in H9 and DF 19-9-11T CM monolayers. Green represents the depolarization phase of the propagating action potential, phase zero; red represents phase 2 or the plateau phase of the action potential; finally orange and yellow represent phase 3 repolarization of the action potential. The white asterisk indicates the phase singularity, the point where all phases of the action potential converge which is the organizing center of the arrhythmic reentry. The white arrows denote the direction of the rotation of the reentrant waves. (F) Immunolabeling of iPSC-CM monolayer (DF19-9-11T) for sacromeric protein α-actinin in combination with α-smooth muscle actin (SMA) and gap junction protein Cx43 and Cx40, respectively. Note abundant staining for α-actinin and Cx43 but no staining for SMA or Cx40. Scale bars are 25 μm. Error bars where shown represent SEM.

Similar articles

Cited by

References

    1. Laflamme MA, Chen KY, Naumova AV, Muskheli V, Fugate JA, Dupras SK, Reinecke H, Xu C, Hassanipour M, Police S, O’Sullivan C, Collins L, Chen Y, Minami E, Gill EA, Ueno S, Yuan C, Gold J, Murry CE. Cardiomyocytes derived from human embryonic stem cells in pro-survival factors enhance function of infarcted rat hearts. Nat Biotechnol. 2007;25:1015–1024. - PubMed
    1. Yang L, Soonpaa MH, Adler ED, Roepke TK, Kattman SJ, Kennedy M, Henckaerts E, Bonham K, Abbott GW, Linden RM, Field LJ, Keller GM. Human cardiovascular progenitor cells develop from a kdr+ embryonic-stem-cell-derived population. Nature. 2008;453:524–528. - PubMed
    1. Kattman SJ, Witty AD, Gagliardi M, Dubois NC, Niapour M, Hotta A, Ellis J, Keller G. Stage-specific optimization of activin/nodal and bmp signaling promotes cardiac differentiation of mouse and human pluripotent stem cell lines. Cell Stem Cell. 2011;8:228–240. - PubMed
    1. Elliott DA, Braam SR, Koutsis K, Ng ES, Jenny R, Lagerqvist EL, Biben C, Hatzistavrou T, Hirst CE, Yu QC, Skelton RJ, Ward-van Oostwaard D, Lim SM, Khammy O, Li X, Hawes SM, Davis RP, Goulburn AL, Passier R, Prall OW, Haynes JM, Pouton CW, Kaye DM, Mummery CL, Elefanty AG, Stanley EG. Nkx2-5(egfp/w) hescs for isolation of human cardiac progenitors and cardiomyocytes. Nat Methods. 2011;8:1037–1040. - PubMed
    1. Dubois NC, Craft AM, Sharma P, Elliott DA, Stanley EG, Elefanty AG, Gramolini A, Keller G. Sirpa is a specific cell-surface marker for isolating cardiomyocytes derived from human pluripotent stem cells. Nat Biotechnol. 2011;29:1011–1018. - PMC - PubMed

Publication types

MeSH terms