. 2012 Dec;61(12):3239-46.
doi: 10.2337/db12-0112. Epub 2012 Aug 21.

Diabetogenic T-cell clones recognize an altered peptide of chromogranin A

Affiliations

Diabetogenic T-cell clones recognize an altered peptide of chromogranin A

Thomas Delong et al. Diabetes. 2012 Dec.

Abstract

Chromogranin A (ChgA) has been identified as the antigen target for three NOD-derived, diabetogenic CD4 T-cell clones, including the well-known BDC-2.5. These T-cell clones respond weakly to the peptide WE14, a naturally occurring proteolytic cleavage product from ChgA. We show here that WE14 can be converted into a highly antigenic T-cell epitope through treatment with the enzyme transglutaminase (TGase). The WE14 responses of three NOD-derived CD4 T-cell clones, each with different T-cell receptors (TCRs), and of T cells from BDC-2.5 TCR transgenic mice are increased after TGase conversion of the peptide. Primary CD4 T cells isolated from NOD mice also respond to high concentrations of WE14 and significantly lower concentrations of TGase-treated WE14. We hypothesize that posttranslational modification plays a critical role in the generation of T-cell epitopes in type 1 diabetes.


Figures
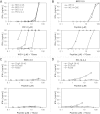
FIG. 1.
FIG. 1.
Treatment of WE14 with TGase significantly increases peptide antigenicity for ChgA-reactive T-cell clones. A: T cells (BDC-2.5, BDC-10.1, BDC-9.46, and PD12.4.4) and APCs were incubated with increasing concentrations of the TGase-treated (bottom) or untreated (top) WE14. T-cell responses were assessed through IFN-γ production measured by ELISA. Data are representative of at least three separate experiments. B: BDC-2.5 was incubated with APCs and increasing concentrations of TGase-treated (bottom) or untreated (top) peptides WE14 and deamidated WE14-Q6E. Data are representative of at least three separate experiments. BDC-2.5 (C) or PD-12.4.4 (D) were incubated with APCs and increasing concentrations of the TGase-treated (bottom) or untreated (top) peptides ChgA29–42, IAPP KS20, and the insulin B-chain. Data are representative of at least three separate experiments.
FIG. 2.
FIG. 2.
CD4 T cells from BDC-2.5 TCR-Tg mice proliferate upon stimulation with WE14. Spleen cells were isolated from BDC-2.5 TCR-Tg (n = 6) or BDC-6.9 TCR-Tg (n = 2) mice and were labeled with CFSE. CFSE dilution was analyzed by flow cytometry, gates were set on the CD4/lymphocyte gate, and average percentages of divided cells and SDs from two independent experiments are indicated. A: Single-cell suspensions (1 × 10⁶/well) of transgenic T cells were cultured in the presence of CM, α-CD3 (0.1 μg/mL), WE14 (200 μg/mL or 120 μmol/L), HRPI (0.4 ng/mL or 0.21 nmol/L), ChgA29–42 (200 μg/mL or 127 μmol/L), or KS20 (1 μg/mL or 0.45 nmol/L). Histograms are from one representative mouse, and average percentages of proliferation and SD are from six BDC-2.5 TCR-Tg and two BDC-6.9 TCR-Tg mice. B: Single-cell suspensions (1 × 10⁶/well) were labeled with CFSE and were cultured in IL-2 containing media in the presence of WE14 or TGase-treated WE14. Data shown are average percentages of proliferation from three individual BDC-2.5 TCR-Tg mice and are representative of three independent experiments.
FIG. 3.
FIG. 3.
IFN-γ responses of CD4 T cells from BDC-2.5 TCR-Tg mice to WE14 are increased after conversion of the peptide by TGase. Spleen cells from BDC-2.5 TCR-Tg and BDC-6.9 TCR-Tg mice were incubated with WE14 or TGase-treated WE14 in 96-well plates. Supernatants were harvested after 4 days and assayed for the presence of IFN-γ by ELISA. Data are from two separate experiments with a total of six BDC-2.5 TCR-Tg and two BDC-6.9 TCR-Tg mice.
FIG. 4.
FIG. 4.
T cells from NOD mice are activated by WE14, and responses are increased after TGase treatment of the peptide. Spleen cells from 6–8-week-old NOD or BALB/c mice were incubated with WE14 (500 μg/mL or 300 μmol/L) or TGase-treated WE14 (22 μg/mL or 13 μmol/L) in 96-well plates. Supernatants were harvested after 5 days and assayed for the presence of IFN-γ by ELISA. Data are representative of two separate experiments, with four NOD mice and one BALB/c mouse in each experiment.
FIG. 5.
FIG. 5.
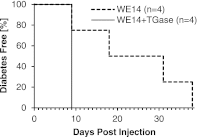
T cells from BDC-2.5 TCR-Tg mice transfer disease more rapidly when activated with TGase-treated WE14. BDC-2.5 TCR-Tg cells were activated with TGase-treated WE14 (solid line) or WE14 (dashed line), and 5 × 10⁶ cells were transferred intraperitoneally into adult NOD.scid mice. Urine glucose was monitored daily, and mice were considered diabetic when two consecutive measurements were >18 mmol/L. Data are from one experiment, and the number of recipient mice per group is indicated. Disease transfer was significantly slower when T cells were activated with WE14 compared with TGase-treated WE14 (P = 0.04).
FIG. 6.
FIG. 6.
The formation of high-MW as well as small-MW aggregates plays a critical role in the increased antigenicity of TGase-treated WE14. A: Silver-stained, Tricine-Tris peptide gel of untreated WE14 and TGase (lanes 11 and 12) and TGase-treated WE14 in the presence of low to high concentrations of the TGase inhibitor putrescine (lanes 2–10) and in the absence of inhibitor (lane 1). In the absence of inhibitor, the peptide forms multimers upon reaction with TGase (bottom, lane 1). The graph in the top panel shows the response of BDC-2.5 to fractions corresponding to 1–12 shown in the gel, with the highest response in the first column, corresponding to lane 1. BDC-2.5 does not respond to untreated WE14 (lane 11) at the low concentration used in this assay. Data are representative of at least three separate experiments. B: Size exclusion chromatography of 5 mg WE14 (top) and 5 mg TGase-treated WE14 (bottom). Protein absorbances were measured at 280 nm. Aliquots of fractions were tested for the presence of antigen using BDC-2.5. Data are representative of two separate experiments.

References

    1. Haskins K. Pathogenic T-cell clones in autoimmune diabetes: more lessons from the NOD mouse. Adv Immunol 2005;87:123–162 - PubMed
    1. Stadinski BD, Delong T, Reisdorph N, et al. Chromogranin A is an autoantigen in type 1 diabetes. Nat Immunol 2010;11:225–231 - PMC - PubMed
    1. Curry WJ, Barkatullah SC, Johansson AN, et al. WE-14, a chromogranin a-derived neuropeptide. Ann N Y Acad Sci 2002;971:311–316 - PubMed
    1. Lorand L, Graham RM. Transglutaminases: crosslinking enzymes with pleiotropic functions. Nat Rev Mol Cell Biol 2003;4:140–156 - PubMed
    1. Nikoopour E, Sandrock C, Huszarik K, et al. Cutting edge: vasostatin-1-derived peptide ChgA29-42 is an antigenic epitope of diabetogenic BDC2.5 T cells in nonobese diabetic mice. J Immunol 2011;186:3831–3835 - PubMed

Publication types