. 2012;10(7):e1001369.
doi: 10.1371/journal.pbio.1001369. Epub 2012 Jul 31.

Systematic dissection of roles for chromatin regulators in a yeast stress response

Affiliations

Systematic dissection of roles for chromatin regulators in a yeast stress response

Assaf Weiner et al. PLoS Biol. 2012.

Abstract

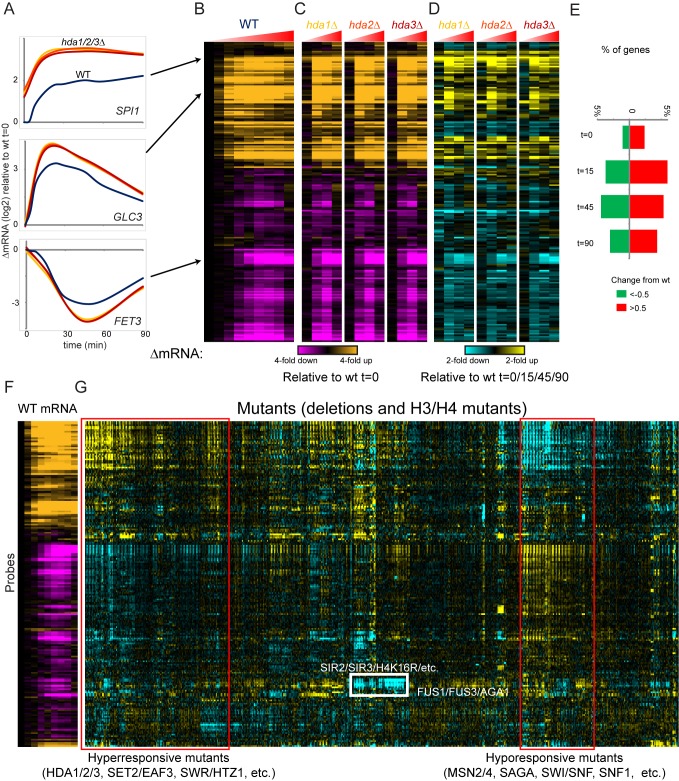
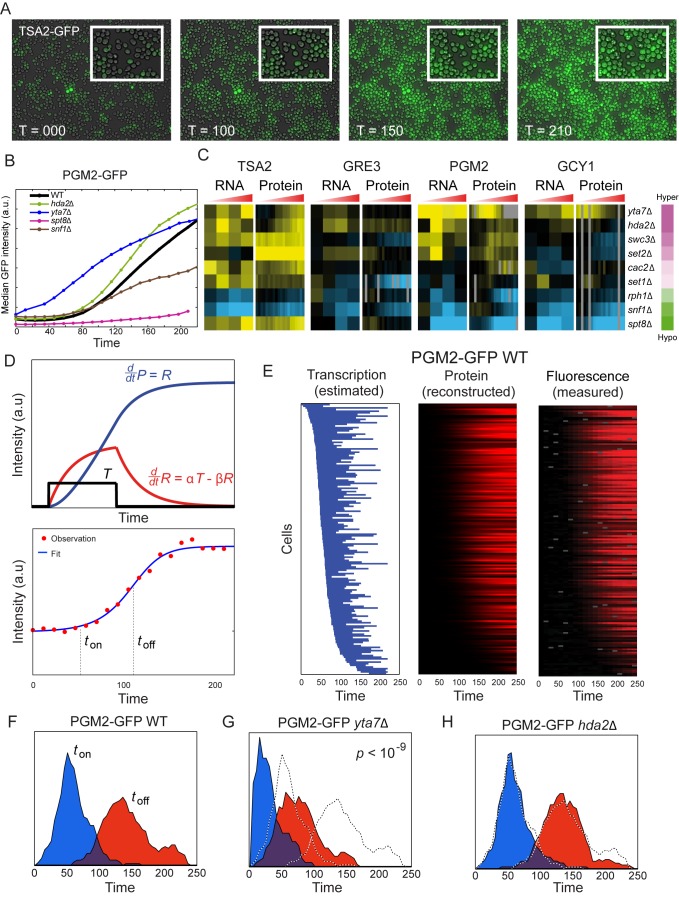
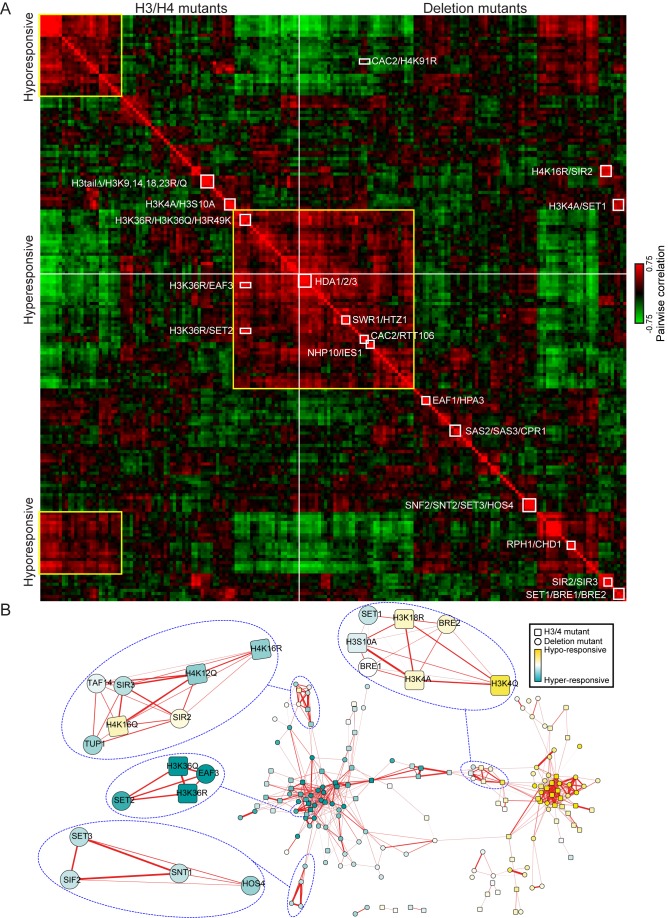
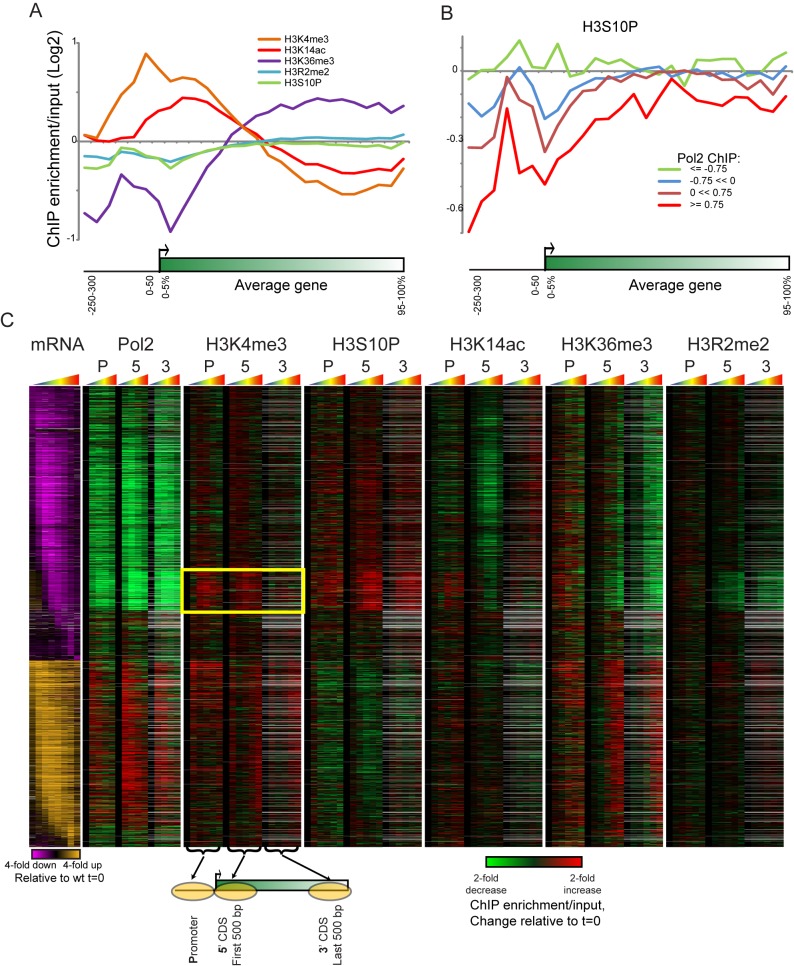
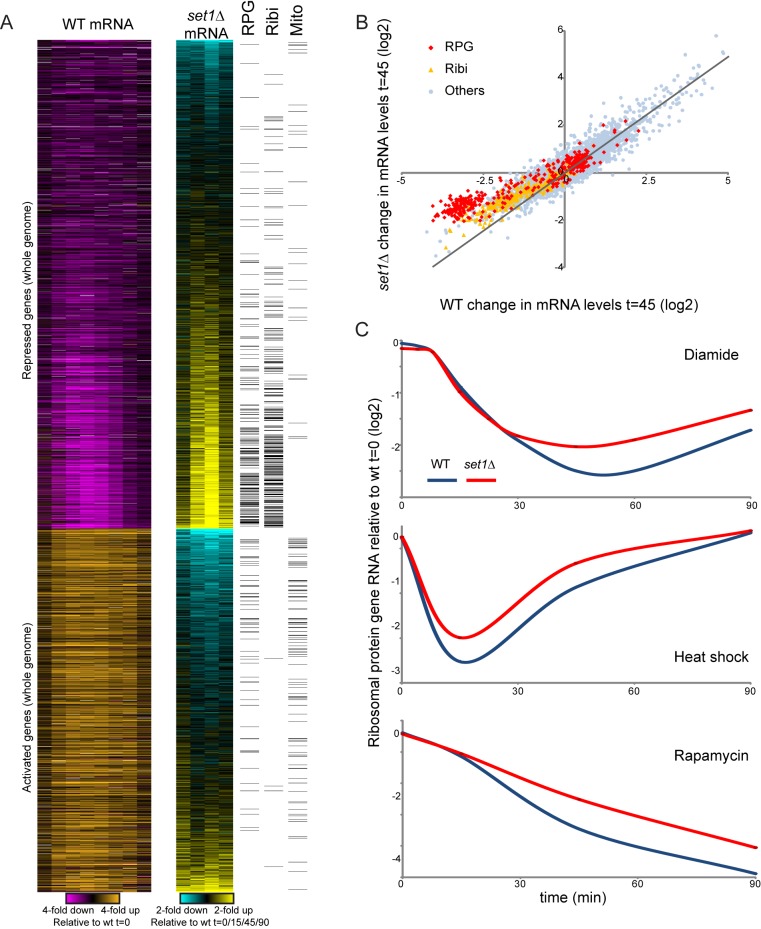
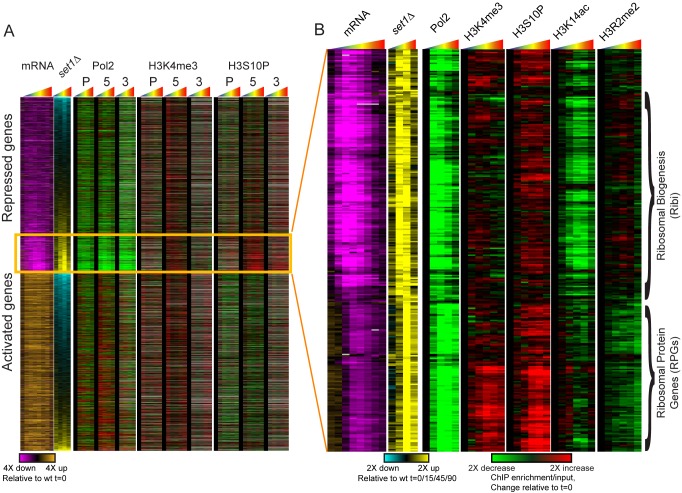
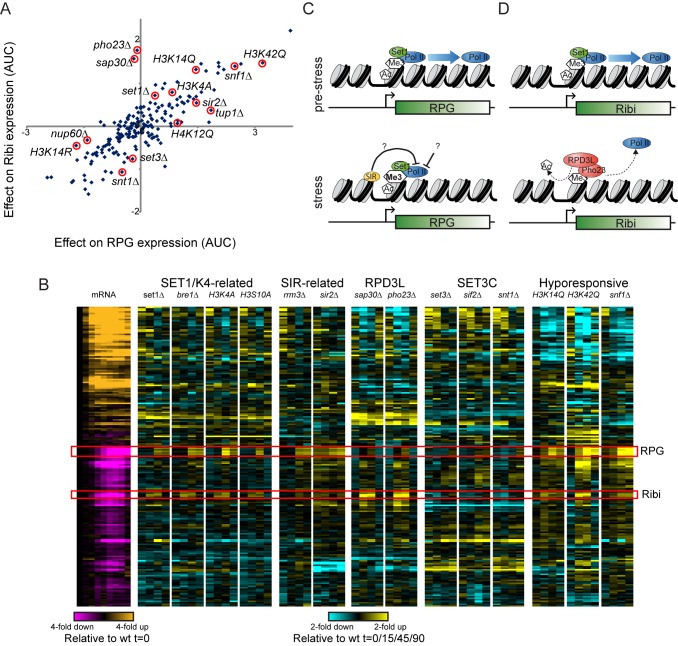
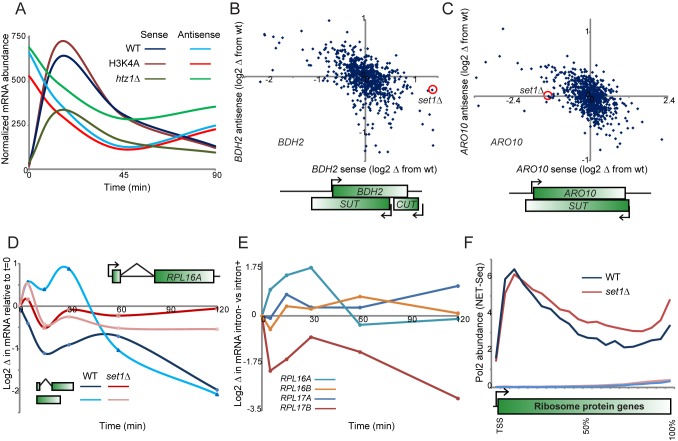
Packaging of eukaryotic genomes into chromatin has wide-ranging effects on gene transcription. Curiously, it is commonly observed that deletion of a global chromatin regulator affects expression of only a limited subset of genes bound to or modified by the regulator in question. However, in many single-gene studies it has become clear that chromatin regulators often do not affect steady-state transcription, but instead are required for normal transcriptional reprogramming by environmental cues. We therefore have systematically investigated the effects of 83 histone mutants, and 119 gene deletion mutants, on induction/repression dynamics of 170 transcripts in response to diamide stress in yeast. Importantly, we find that chromatin regulators play far more pronounced roles during gene induction/repression than they do in steady-state expression. Furthermore, by jointly analyzing the substrates (histone mutants) and enzymes (chromatin modifier deletions) we identify specific interactions between histone modifications and their regulators. Combining these functional results with genome-wide mapping of several histone marks in the same time course, we systematically investigated the correspondence between histone modification occurrence and function. We followed up on one pathway, finding that Set1-dependent H3K4 methylation primarily acts as a gene repressor during multiple stresses, specifically at genes involved in ribosome biosynthesis. Set1-dependent repression of ribosomal genes occurs via distinct pathways for ribosomal protein genes and ribosomal biogenesis genes, which can be separated based on genetic requirements for repression and based on chromatin changes during gene repression. Together, our dynamic studies provide a rich resource for investigating chromatin regulation, and identify a significant role for the "activating" mark H3K4me3 in gene repression.


Conflict of interest statement

The authors have declared that no competing interests exist.

Figures

Figure 1
Figure 1. Chromatin mutant effects on mRNA expression dynamics during stress.
(A) Time course data for three genes in wild type and three mutant (hda1Δ, hda2Δ, and hda3Δ) yeast. For each time course, data are normalized to wild type t = 0. Wild type time course includes nine time points after diamide addition (0, 4, 8, 15, 22.5, 30, 45, 60, and 90 min after diamide addition), while mutant time courses cover four time points (t = 0, 15, 45, 90). (B) Wild type stress response. Data for all 200 probes are shown as log(2) fold change relative to t = 0, with probes ordered by hierarchical clustering . (C) As in (B), but for the three indicated mutants. As in (B), data are normalized to wild type t = 0. (D) “Difference map” for three mutants. Here, data for the three mutants are normalized relative to the equivalent wild type time point. hda1Δ t = 15 is compared to wt t = 15, etc. Note that many more dramatic effects on gene expression are observed during diamide stress than are observed at t = 0. (E) Chromatin mutants have more widespread effects on gene expression during the stress response than during steady-state growth in YPD. Plotted are the fraction of (mutant×probe) effects with increased, or decreased, expression of the probe in question. This number represents the fraction of all entries in the 200 probe×202 mutant matrix (for each time point) with an absolute log2 change in RNA abundance of greater than 0.5. (F–G) Entire dataset for diamide stress. (F) shows wild type data as in (B). (G) shows data for 202 indicated mutants, normalized relative to equivalent wild type time points as in (D). All four time points for each mutant are contiguous, resulting in a “striped” appearance for groups of mutants that specifically affect a subset of time points during diamide stress. Red boxes indicate large groups of mutants that exhibit a widespread decrease (“hyporesponsive”) or increase (“hyperresponsive”) in the amplitude of the overall diamide stress response. White box indicates an example of a subcluster expected from prior knowledge. Mutants in the Sir heterochromatin complex express pheromone response genes at low levels due to the “pseudodiploid” state caused by derepression of the silent mating loci in these mutants. Data are also provided in Table S1.
Figure 2
Figure 2. Single cell analysis of mutant effects on gene induction.
(A) Sample images from a time-lapse microscope analysis of a Tsa2-GFP fusion reporter at the indicated times after diamide treatment. Midlog yeast cells were grown in a mono-cell layer on glass bottom plate coated with Concavalin-A. The cells are attached to the glass and thus remain at the same location in successive images. Shown is GFP image overlaid on transmitted light image (both at 40× magnification). (B) Time course fluorescence data for Pgm2-GFP for wild-type and the four indicated mutants. Each curve represents median fluorescence versus time for responding cells of a specific strain (n∼250±100). (C) Protein expression recapitulates mutant effects on RNA abundance. Data are shown for four GFP fusions, each analyzed in nine deletion mutants. Left panel shows hyper/hypo responsiveness score for the mutant in question (Figure S2). For each of the four promoters, left panel shows RNA data as in Figure 1G, while right panel shows the log-ratio between median GFP expression in wild-type and in a given mutant. (D) Analytical model to extract promoter “open” time and expression rate. A simple model in which cells transition from a low expression state to a high expression state was fit for each cell, resulting in three parameters: ton (time from diamide treatment to beginning of high expression), toff (time of return to low expression), and production rate during high expression. Figure shows data (red dots) and fit (blue curve) for a single cell expressing Pgm2-GFP. (E) Model accurately captures GFP expression with few parameters. Left panel shows the duration of the high expression state for Pgm2-GFP (wild-type) as a blue bar, with cells ordered by ton. Middle panel shows model predictions of protein levels. Right panel shows data for each cell. (F–H) Two hyperresponsive mutants differ in the mechanism for enhanced Pgm2-GFP production. Histograms of single cell distributions for ton (blue) and toff (red) are shown for wild-type (F), yta7Δ (G), and hda2Δ (H). While yta7Δ mutants clearly are hyperresponsive due to abnormally rapid gene induction, the minor changes in ton and toff in hda2Δ mutants suggest that these mutants instead are hyperresponsive to diamide as a result of increased RNA/protein production per unit time during the stress response. This could result from an effect on RNA polymerase burst size or elongation rate, or RNA stability.
Figure 3
Figure 3. Correlation matrix identifies complex membership and enzyme-substrate relationships.
(A) Correlation matrix for all 202 mutants. Correlation between each mutant's effects on diamide stress response was calculated across the entire time course, and mutants were clustered by correlation coefficient. Rows and columns are ordered identically. Note that histone mutants and gene deletion mutants are kept separate, as indicated. Boxes indicate an illustrative subset of highly correlated groups of mutants corresponding to known co-membership in protein complexes (e.g., SIR2/SIR3), known pathways (e.g., SWR1/HTZ1), novel predicted pathways (e.g., RPH1/CHD1), and expected or novel relationships between histone residues and chromatin regulators (e.g., H3K36/SET2/EAF3). (B) Network wiring of chromatin regulators. Genes were grouped according to correlations (thresholded at 0.45), and related genes are clustered using cytoscape implementation of the spring embedded layout . Subnetworks corresponding to several complexes are emphasized as indicated.
Figure 4
Figure 4. Genome-wide histone modification changes during diamide stress.
(A) Metagene analysis of the five histone marks analyzed here. The indicated modifications were mapped genome-wide by ChIP-chip using ∼250 bp resolution tiling microarrays, normalized to nucleosome occupancy. All genes are length-normalized, and ChIP enrichments for the five marks at t = 0 (e.g., midlog growth) are shown averaged for all genes. (B) Metagene analysis for genes grouped according to RNA Polymerase abundance as measured in Kim et al. , with H3S10P mapping data averaged for each set of genes. (C) Chromatin changes at all diamide-regulated genes. Genes up- or down-regulated by over 1.8-fold are shown, with mRNA changes represented in orange/purple. Genes are ordered by time of change in gene expression . Tiling microarray probes for Pol2 and for five histone marks were associated with gene promoters, 5′ ends, or 3′ ends as shown in schematic underneath Pol2 panel . Data for each time course are shown as changes relative to t = 0, thus representing the change in the modification over the time course of diamide stress. Pol2 data are for t = 0, 15, 30, 60, and 120 min after diamide stress, whereas histone modification data were collected at t = 0, 4, 8, 15, 30, and 60 min after diamide stress. Grey entries represent missing data (generally due to an absence of any microarray probes at the relevant genomic location). Yellow box highlights “paradoxical” gain of H3K4me3 at the 5′ ends of a large group of diamide-repressed genes.
Figure 5
Figure 5. Set1 is predominantly a repressor during diamide stress.
(A) Whole genome analysis of set1Δ effects on diamide stress response. Left panel: gene expression data from Gasch et al. for all genes induced or repressed at least 1.8-fold. Middle panel: effect of set1Δ on diamide stress, for t = 0, 15, 45, or 90 min, using whole-genome microarray data. Genes are grouped by repressed/activated, then subsequently sorted by the average set1Δ effect on gene expression. Right panel: ribosomal protein (RPG) or ribosomal biogenesis (Ribi) GO annotations for individual genes are indicated as black bars. The majority of genes that repress poorly in set1Δ mutants are involved in cytoplasmic ribosome biosynthesis. (B) Set1 functions primarily as a repressor. Scatterplot of change in mRNA abundance in wild-type (x-axis) or set1Δ (y-axis) yeast at diamide t = 45 min. There is overall excellent correlation between the two datasets except for blunted repression of ribosomal protein genes and ribosomal biogenesis genes, as indicated. (C) Set1 affects ribosomal gene repression in response to multiple distinct environmental conditions. Wild type and set1Δ yeast were subjected to time courses of diamide stress, 37°C heat shock, or 0.2 µg/mL rapamycin. RNA abundance was measured by nCounter, and normalized ribosomal protein gene RNA abundances are averaged and shown as log2 abundance. Note that for all three stresses, Set1 is required for full RPG repression.
Figure 6
Figure 6. Specific chromatin changes occur at RPG and Ribi genes during repression.
(A) Whole genome mRNA , set1Δ effects on mRNA (this study), Pol2 mapping , and tiling microarray data for H3K4me3 and H3S10P (this study) are shown for all genes sorted as in Figure 5A. All four datasets represent a time course of diamide response, as indicated by rainbow triangles above each box. (B) RPG and Ribi genes exhibit distinct chromatin changes during diamide stress. Diamide-repressed genes whose repression is diminished in set1Δ mutants were clustered according to their associated changes in chromatin marks. Tiling microarray data are shown only for 5′CDS probes for each mark. A clear separation can be observed between RPGs, which exhibit increased 5′ H3K4me3 and decreased 5′ H3R2me2, and Ribi genes, which exhibit decreased 5′ H3K14ac.
Figure 7
Figure 7. Differential regulation of RPG and Ribi genes by RPD3L.
(A) In silico analysis of mutant effects on RPG and Ribi gene expression. nCounter data were averaged for RPG or Ribi genes, and for each mutant the difference between mutant and wild-type expression is scatterplotted for the two gene classes. Specific mutants of interest are indicated with red circles. In general mutants have highly correlated effects on expression of these genes during diamide stress, with globally hypo-responsive mutants such as H3K42Q exhibiting diminished repression of both gene classes. However, a subset of mutants separate RPG from Ribi gene expression. Most notably, mutants in the RPD3L complex (sap30Δ and pho23Δ) have no effect on RPG repression, but dramatically affect Ribi repression. (B) nCounter data for selected mutants with variable effects on RPG/Ribi gene repression. Data are shown as in Figure 1B,D. Mutants from several complexes of interest are highlighted here. (C–D) Model for Set1-dependent RPG (C) and Ribi (D) repression. See main text.
Figure 8
Figure 8. Set1 effects on antisense and intron-containing genes.
(A) Anticorrelated abundance of sense and antisense transcripts for BDH2. nCounter intensity values are plotted for the sense and antisense transcripts at this locus for wild-type and two indicated mutants. (B–C) Set1 skews sense-antisense ratios. Scatterplot of mutant effects on sense and antisense transcripts for BDH2 and ARO10. Each point in the scatterplot represents the change in expression from wild-type for a given mutant at a specific time point. Here, in both cases, we highlight the effect of set1Δ at t = 15 min. For both genes the local transcript structure as defined in Xu et al. is schematized. (D) Regulation of RPL16A by its intron. Expression of RPL16A was measured by q-RT-PCR (normalized relative to snR13), for either wild-type RPL16A or for yeast carrying an intronless RPL16A in its endogenous location. For both versions of this gene, parallel experiments were carried out in set1Δ. (E) Introns contribute to diamide regulation of RPGs. For the four indicated RPGs, the difference in diamide effects on mRNA was calculated for intron-containing versus intronless versions of the gene, as indicated. (F) Set1 plays a role in RPG transcription pausing or termination. Sense strand NET-Seq data from Churchman et al. are shown for all RPGs, for wt and set1Δ as indicated. The two lines near the x-axis show NET-Seq data on the antisense strand.

Comment in

Similar articles

Cited by

References

    1. Kornberg RD, Lorch Y (1999) Twenty-five years of the nucleosome, fundamental particle of the eukaryote chromosome. Cell 98: 285–294. - PubMed
    1. Clapier CR, Cairns BR (2009) The biology of chromatin remodeling complexes. Annu Rev Biochem 78: 273–304. - PubMed
    1. Kouzarides T (2007) Chromatin modifications and their function. Cell 128: 693–705. - PubMed
    1. Rando OJ, Chang HY (2009) Genome-wide views of chromatin structure. Annu Rev Biochem 78: 245–271. - PMC - PubMed
    1. Strahl BD, Allis CD (2000) The language of covalent histone modifications. Nature 403: 41–45. - PubMed

Publication types

MeSH terms

Associated data