. 2012;7(8):e38695.
doi: 10.1371/journal.pone.0038695. Epub 2012 Aug 13.

Group normalization for genomic data

Affiliations

Group normalization for genomic data

Mahmoud Ghandi et al. PLoS One. 2012.

Abstract

Data normalization is a crucial preliminary step in analyzing genomic datasets. The goal of normalization is to remove global variation to make readings across different experiments comparable. In addition, most genomic loci have non-uniform sensitivity to any given assay because of variation in local sequence properties. In microarray experiments, this non-uniform sensitivity is due to different DNA hybridization and cross-hybridization efficiencies, known as the probe effect. In this paper we introduce a new scheme, called Group Normalization (GN), to remove both global and local biases in one integrated step, whereby we determine the normalized probe signal by finding a set of reference probes with similar responses. Compared to conventional normalization methods such as Quantile normalization and physically motivated probe effect models, our proposed method is general in the sense that it does not require the assumption that the underlying signal distribution be identical for the treatment and control, and is flexible enough to correct for nonlinear and higher order probe effects. The Group Normalization algorithm is computationally efficient and easy to implement. We also describe a variant of the Group Normalization algorithm, called Cross Normalization, which efficiently amplifies biologically relevant differences between any two genomic datasets.


Conflict of interest statement

Competing Interests: The authors have declared that no competing interests exist.

Figures

Figure 1
Figure 1. Genomic assays are often highly reproducible, but have significant efficiency variation across the genome.
(A) Two genomic hybridization signals (biological replicates) from (Lee et al., 2007) shown along a portion of Chr III are highly reproducible, but deviate significantly from the expected constant signal. (B) Across the whole genome, these variations are highly reproducible. Two genomic hybridizations for the entire yeast genome are highly correlated (Pearson C = 0.966).
Figure 2
Figure 2. Flowchart of Group Normalization.
Control arrays are used to generate reference probe sets for each probe. Then we use the reference probe sets to estimate the probe parameters in the treatment arrays and to generate the normalized signal. We propose two distinct methods to normalize the arrays: a Binary method which parameterizes high and low signal for each probe (μlow, μhigh); or a Quantile-based method which uses the rank of each probe in the reference set.
Figure 3
Figure 3. Overview of Group Normalization.
Probes are shown sorted by on their values in a genomic hybridization (reference condition, black). For each probe, N = 1000 probes with closest signal in the genomic hybridization are assigned as reference set (dashed boxes) for each probe. Then high (red) and low (green) signal levels in the experimental condition (grey) are estimated from high and low probe signal ranges for each set of reference probes.
Figure 4
Figure 4. Signal Quality measure.
Two tiling array signals corresponding to nucleosome occupancy at two different experimental conditions are shown for the HXT3 locus. We use two conditions and a replicate to determine signal and noise, as follows. In condition A (with glucose), the highlighted region is nucleosome free, and in condition B (no glucose), it is nucleosome bound. S is the difference of the tiling array signal at two different conditions and reflects the signal strength. N is a measure of noise and is estimated by comparing the signal of two replicate microarrays at similar experimental condition. We evaluate S over a set of significantly changed probes (indicated with open circles) and N over all the probes as described in the text. The ratio S/N is a genome wide measure of Signal Quality.
Figure 5
Figure 5. Group Normalization results for nucleosome positioning in yeast.
(A) probe distribution before (left) and after (right) Group Normalization. (B) Inferred nucleosome pattern at HXT3 promoter before (blue ovals) and after (red ovals) glucose addition. HXT3 is upregulated at high glucose levels and repressed at low glucose levels. (C) Differential nucleosome occupancy in yeast in response to glucose addition: cells are grown on glycerol and then 2% glucose is added. Nucleosome positioning is measured before and 60 min after glucose addition (Zawadzki et al., 2009). The top curves show the spatially averaged raw tiling array data, at time zero (gray dotted) and t = 60 (magenta). The lower plot shows the result of our normalization method. The red curve is the normalized differential nucleosome occupancy for t = 60 min compared to t = 0 (high values imply increase in nucleosome occupancy in response to glucose). The blue dotted curve is the reverse analysis, comparing t = 0 to t = 60. The yellow diamonds indicate ADR1 binding regions from ChIP.
Figure 6
Figure 6. Group Normalization results for histone H3 mutant dataset.
Nucleosome occupancy in wild type (HHT2) and histone H3 mutant (hht2-AG) near AGE1 on yeast chromosome IV is show for region plotted in Figure 8 of (He et al 2008). A) Nucleosome occupancy plots using Affymetrix TAS software as was used by (HE et al 2008). The dotted box shows the location for the change in nucleosome occupancy. (B) Group Normalization makes it somewhat easier to detect the differentially occupied promoter and clearly identifies the bound regions, but (C) cross normalization more strongly amplifies the differentially occupied region.
Figure 7
Figure 7. Signal Quality comparison of Group Normalization to other methods.
We applied different normalization methods to the nucleosome positioning data and measured the Signal Quality using MAS5, quantile normalization (Q-Q), and MAT. Binary Group Normalization (GN-binary) has higher Signal Quality than all other approaches tested. Quantile normalization (GN-quant) outperforms MAS5 and Q-Q but not MAT on this dataset. We also examined the sensitivity of binary Group Normalization to different choices of low and high probe ranges used to estimate μlow and μhigh: (μlow, μhigh) = a: (.10–.40,.60–.90), b: (.05–.50,.80–.95), c:(.10–.50,.50–.90), and d:(.10–.30,.70–.90). All of these choices give virtually identical Signal Quality improvement.
Figure 8
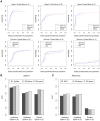
Figure 8. Comparison with spike-in benchmark data of Johnson et al. (2008).
A) We compare ROC-like curves for different platforms and algorithms: Splitter, which had the best performance on Agilent data, and MAT, which had the best performance on Affymetrix data. Area under the ROC-like curve (AUC) is shown for B) Agilent and C) Affymetrix datasets. Except for the diluted Affymetrix spike-in data, which had poor performance with all methods, Group Normalization (both GN-binary and GN-quant) consistently performs better than previous methods, and has a higher sensitivity to recover spike-in regions at the same false positive rate.

Similar articles

References

    1. Lee W, Tillo D, Bray N, Morse RH, Davis RW, et al. (2007) A high-resolution atlas of nucleosome occupancy in yeast. Nat Genet 39: 1235–1244. - PubMed
    1. Park PJ (2009) ChIP-seq: advantages and challenges of a maturing technology. Nat Rev Genet 10: 669–680. - PMC - PubMed
    1. Gilad Y, Borevitz J (2006) Using DNA microarrays to study natural variation. Curr Opin Genet Dev 16: 553–558. - PubMed
    1. Tarazona S, García-Alcalde F, Dopazo J, Ferrer A, Conesa A (2011) Differential expression in RNA-seq: A matter of depth. Genome Res 21: , 2213–2223. - PMC - PubMed
    1. Lee D, Karchin R, Beer MA (2011) Discriminative prediction of mammalian enhancers from DNA sequence. Genome Res 21: 2167–2180. - PMC - PubMed

Publication types

MeSH terms

Substances

LinkOut - more resources