. 2012;7(8):e42994.
doi: 10.1371/journal.pone.0042994. Epub 2012 Aug 13.

Overexpression of guanylate cyclase activating protein 2 in rod photoreceptors in vivo leads to morphological changes at the synaptic ribbon

Affiliations

Overexpression of guanylate cyclase activating protein 2 in rod photoreceptors in vivo leads to morphological changes at the synaptic ribbon

Natalia López-del Hoyo et al. PLoS One. 2012.

Abstract

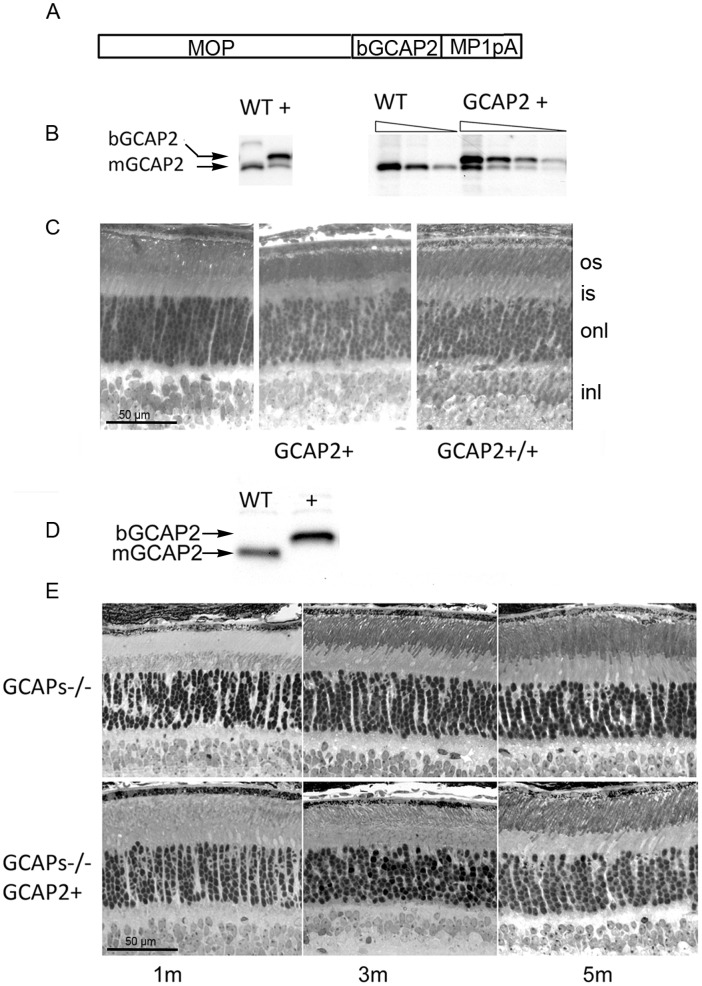
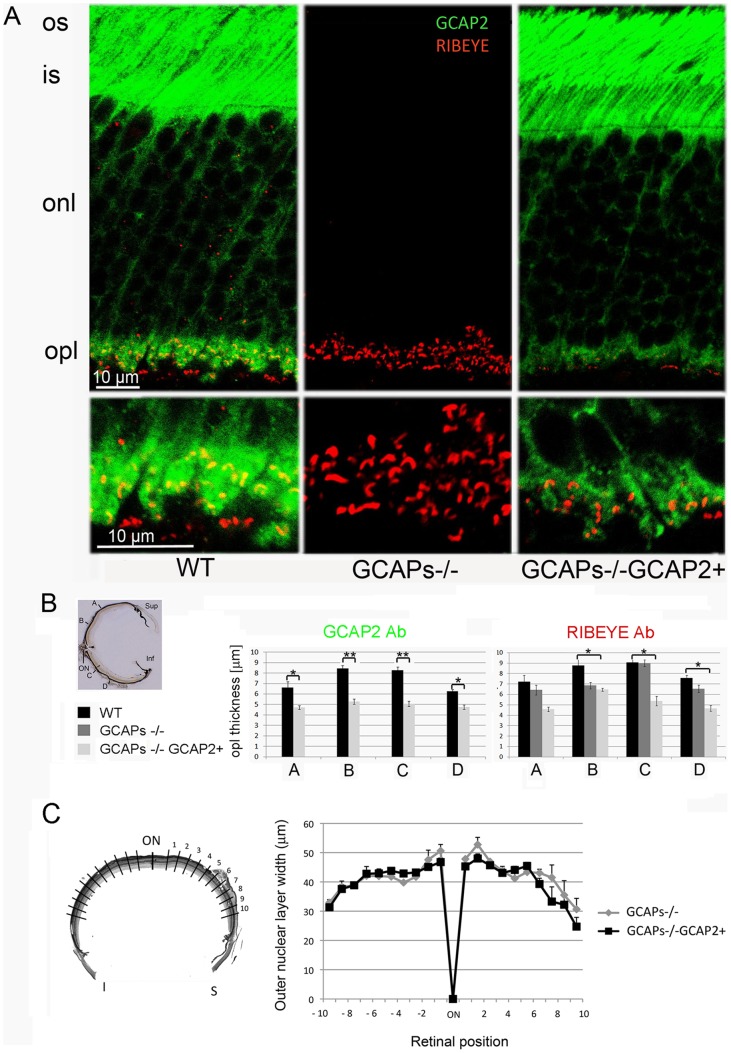
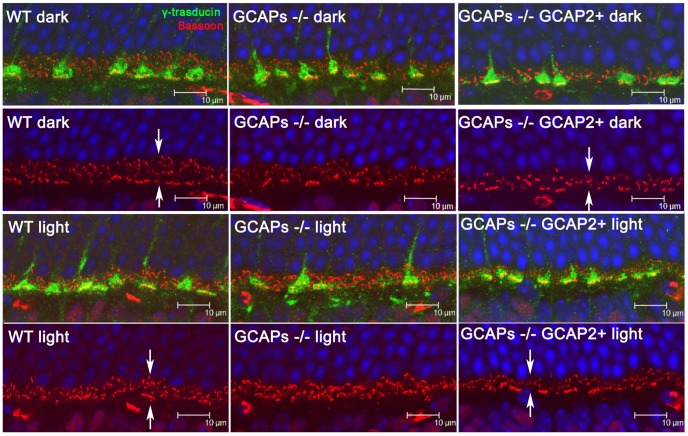
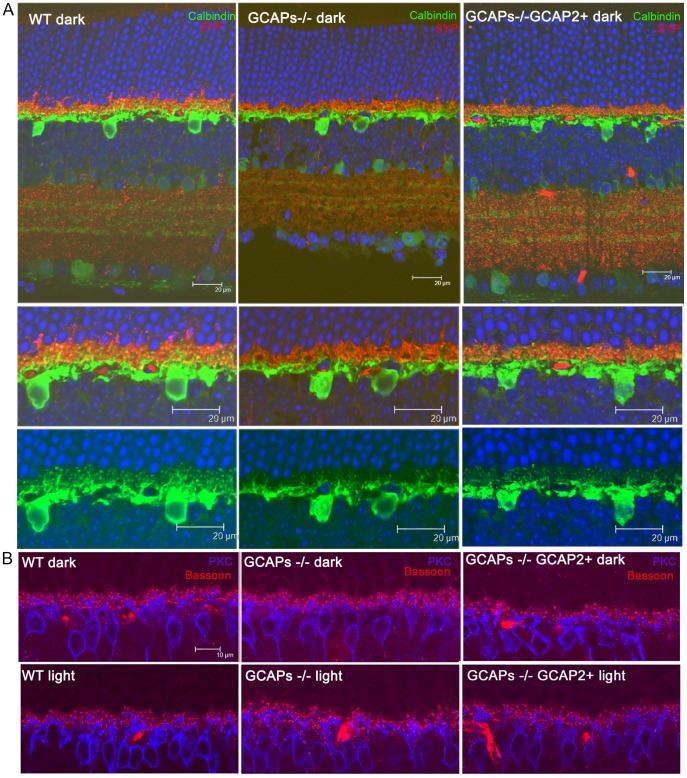
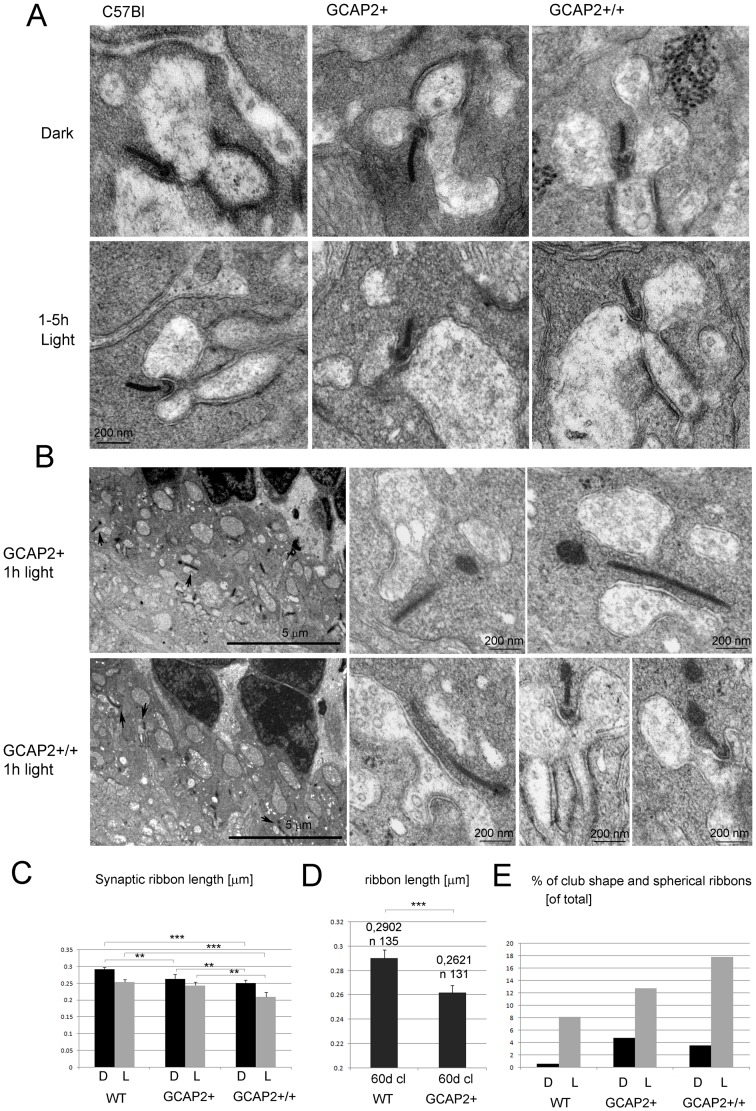
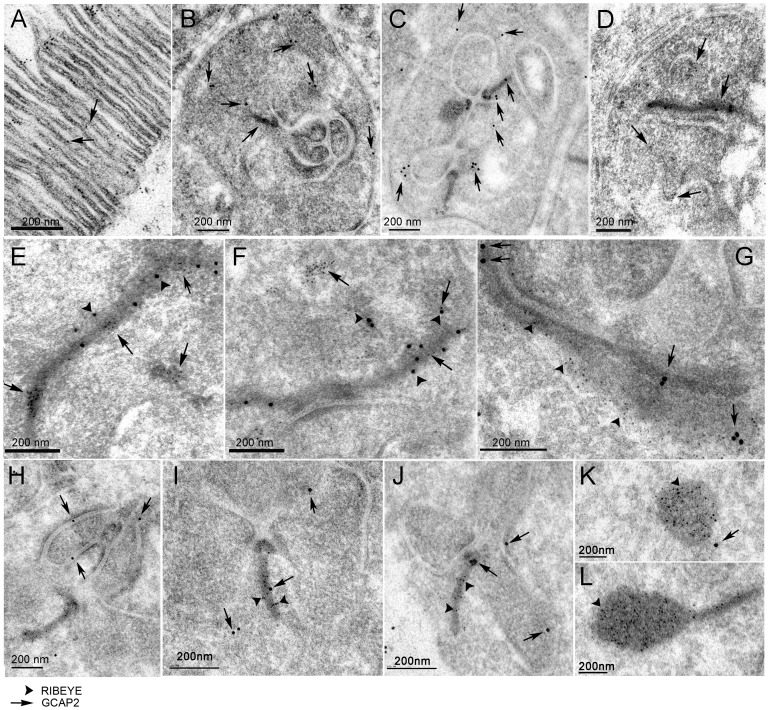
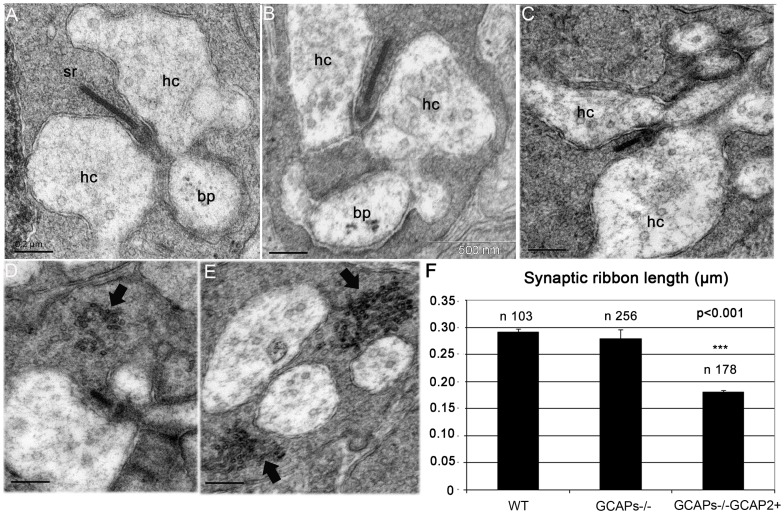
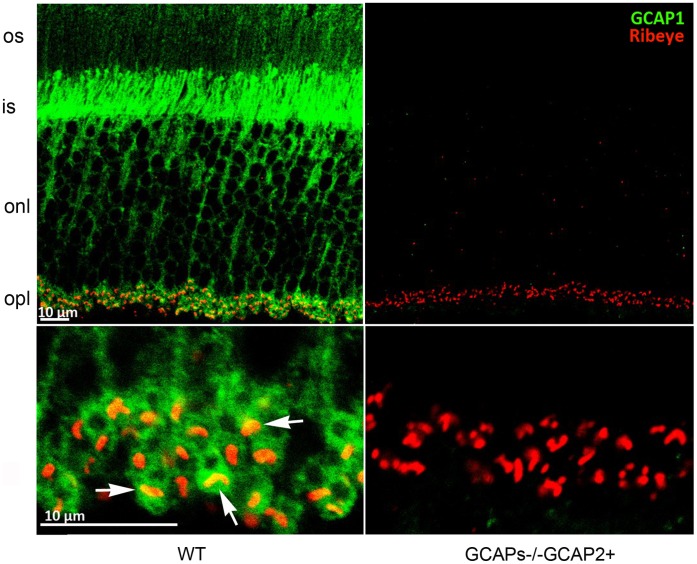
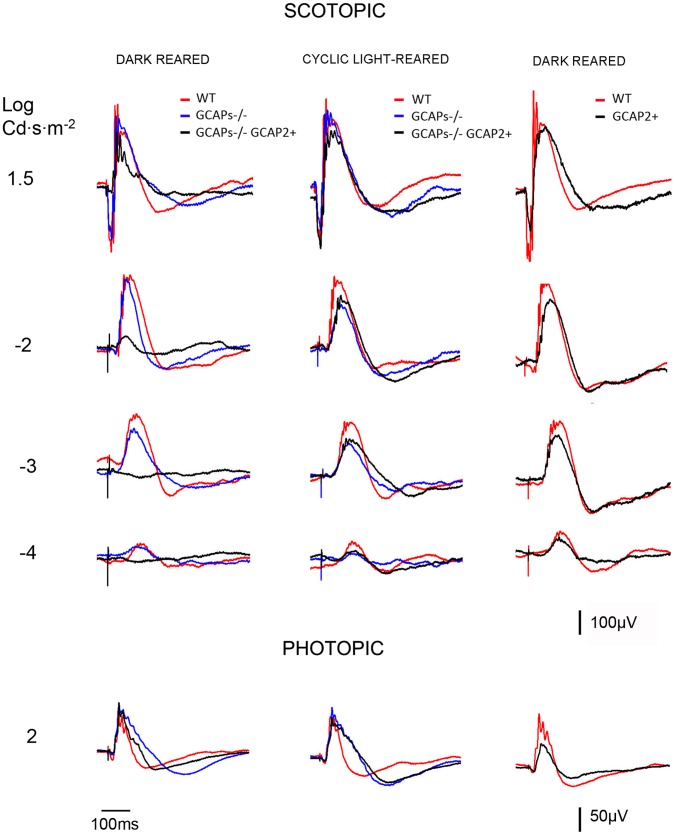
Guanylate cyclase activating proteins are EF-hand containing proteins that confer calcium sensitivity to retinal guanylate cyclase at the outer segment discs of photoreceptor cells. By making the rate of cGMP synthesis dependent on the free intracellular calcium levels set by illumination, GCAPs play a fundamental role in the recovery of the light response and light adaptation. The main isoforms GCAP1 and GCAP2 also localize to the synaptic terminal, where their function is not known. Based on the reported interaction of GCAP2 with Ribeye, the major component of synaptic ribbons, it was proposed that GCAP2 could mediate the synaptic ribbon dynamic changes that happen in response to light. We here present a thorough ultrastructural analysis of rod synaptic terminals in loss-of-function (GCAP1/GCAP2 double knockout) and gain-of-function (transgenic overexpression) mouse models of GCAP2. Rod synaptic ribbons in GCAPs-/- mice did not differ from wildtype ribbons when mice were raised in constant darkness, indicating that GCAPs are not required for ribbon early assembly or maturation. Transgenic overexpression of GCAP2 in rods led to a shortening of synaptic ribbons, and to a higher than normal percentage of club-shaped and spherical ribbon morphologies. Restoration of GCAP2 expression in the GCAPs-/- background (GCAP2 expression in the absence of endogenous GCAP1) had the striking result of shortening ribbon length to a much higher degree than overexpression of GCAP2 in the wildtype background, as well as reducing the thickness of the outer plexiform layer without affecting the number of rod photoreceptor cells. These results indicate that preservation of the GCAP1 to GCAP2 relative levels is relevant for maintaining the integrity of the synaptic terminal. Our demonstration of GCAP2 immunolocalization at synaptic ribbons at the ultrastructural level would support a role of GCAPs at mediating the effect of light on morphological remodeling changes of synaptic ribbons.


Conflict of interest statement

Competing Interests: The authors have declared that no competing interests exist.

Figures

Figure 1
Figure 1. Mouse models of overexpression of GCAP2 and loss-of-function of GCAP1 and GCAP2 used in the study.
A. GCAP2 transgene construct. MOP, 4.4 kb-version of the mouse opsin promoter; bGCAP2, cDNA of bovine GUCA1B gene encoding guanylate cyclase activator protein 2 (GCAP2); MP1pA, polyadenylation signal of mouse protamine gene 1. B. Western blot of total retinal homogenates illustrating GCAP2 level of expression in the GCAP2+ line. Equivalent fractions of a retina (1/10) of WT and GCAP2+ mice were resolved in a 12% SDS-PAGE, transferred to a nitrocellulose membrane and incubated with a polyclonal Ab anti-GCAP2. The bovine (transgenic) and murine (endogenous) isoforms of GCAP2 can be resolved on the basis of their 3-aa difference in size. In the GCAP2+ transgenic line bGCAP2 is expressed to 1.5-fold the endogenous GCAP2 expression . C. Light micrographs of vertical sections of the retina of dark-reared WT, GCAP2+ and GCAP2+/+ (transgenic line bred to homozygosity, that expresses transgenic GCAP2 to 3-fold the endogenous GCAP2 level) at postnatal day 40. Mice overexpressing GCAP2 show at this age a normal retinal morphology. D. Expression of bGCAP2 transgene in the GCAP1/GCAP2 double knockout background (GCAPs−/− background). Western blot shows expression of transgenic bGCAP2 in the absence of endogenous GCAP2 in the GCAPs−/−GCAP2+ mice. E. Light micrographs of vertical sections of the retina from GCAPs−/− and GCAPs−/−GCAP2+ at 1, 3 or 5 months of age, when reared in standard cyclic light. Mice lacking GCAP1 and GCAP2 retain the normal thickness of outer nuclear layer, that is, the normal number of photoreceptor cells for up to 8 months of age. Mice in which GCAP2 expression is restored in the GCAPs−/− background do not show obvious signs of retinal degeneration at the light microscopy level.
Figure 2
Figure 2. Mice that express GCAP2 in the GCAPs−/− background show a reduction of outer plexiform layer (OPL) thickness compared to wildtype mice.
A. Immunolabeling of vertical retinal sections from WT, GCAPs−/− and GCAPs−/−GCAP2+ mice with rabbit polyclonal antibodies anti-GCAP2 and a monoclonal antibody against Ribeye(B)/CtBP2. GCAP2 antibodies give a strong immunolabeling signal at the outer segment (os), inner segment (is) and outer plexiform layer (opl) of the retina. This signal is absent in GCAPs−/− mice, and is restored in GCAPs−/−GCAP2+ mice, in which the GCAP2 transgenic protein reproduces the endogenous GCAP2 intracellular localization. GCAP2 partially colocalizes with Ribeye at ribbon synapses, as pointed by white arrows in WT magnified OPL panel, as previously reported . This figure shows that the expression of GCAP2 in the GCAPs−/− background, that is, GCAP2 expression in the absence of GCAP1, leads to a substantial shortening of the OPL: compare immunolabeling intensity and thickness of the OPL in WT and GCAPs−/−GCAP2+ panels. B. Statistical analysis of the outer plexiform layer thickness in the WT, GCAPs−/− and GCAPs−/−GCAP2+ phenotypes. Measurements of OPL thickness were taken at four different regions along vertical sections of the central retina (A, B, C and D in inset) for each phenotype. WT, GCAPs−/− and GCAPs−/−GCAP2+ mice were raised in constant darkness and processed at p40. OPL thickness was determined at each position based on measurements of the anti-GCAP2 Ab immunolabeled region (left histogram) or anti-Ribeye mAb immunolabeled region (right histogram) at the laser scanning confocal microscope. In GCAPs−/−GCAP2+ mice the OPL thickness is reduced to 60–65% of the wildtype OPL. Values in histograms are the mean ± standard deviation from measurements taken from four mice per phenotype. * denotes P<0.01; ** denotes P<0.001 in the Student’s t-test. C. Mice that express GCAP2 in the absence of GCAP1 (GCAPs−/−GCAP2+) retain the normal quantity of photoreceptor cells at p40 when raised in constant darkness. The retinal morphometry analysis shows that outer nuclear layer thickness (in µm) at 200 µm intervals covering the whole length of the vertical central retina (left diagram) is undistinguishable in GCAPs−/− and GCAPs−/−GCAP2+ mice at p40 (overlapping graphs). Mean values ± standard error were obtained from at least three littermate mice per phenotype.
Figure 3
Figure 3. Outer plexiform layer reduction in GCAPs−/−GCAP2+ mice takes place regardless of whether the mice are raised in constant darkness or in 12
h dark : 12 h light cyclic light. Immunolabeling of synaptic active zones (arciform densities) with a monoclonal antibody anti-Bassoon (in red), and cone pedicules with a polyclonal antibody anti-transducin γ (in green) in WT, GCAPs−/− and GCAPs−/−GCAP2+ retinas. Mice were either raised in darkness (two upper rows) or were raised in standard 12 h dark : 12 h cyclic light (two lower rows) and processed at p40. OPL thickness in GCAPs−/−GCAP2+ mice was reduced to about 65% of wildtype thickness independently of the light-rearing conditions [compare OPL thickness in WT and GCAPs−/− GCAP2+ panels, arrows].
Figure 4
Figure 4. Reduction in the density of horizontal and bipolar cell dendritic processes in mice that express GCAP2 in the GCAPs−/− background.
A. Immunolabeling of horizontal cells by indirect immunofluorescence with anti-Calbindin polyclonal antibodies [green signal] and rod and cone synaptic terminals with a monoclonal antibody anti-Synaptophysin [SYP, red signal] in WT, GCAPs−/− and GCAPs−/−GCAP2+ mice raised in constant darkness. Note the reduction in density and complexity of horizontal cell processes in GCAPs−/− and GCAPs−/−GCAP2+ retinas compared to WT samples. B. Immunolabeling of bipolar cells with a polyclonal antibody against PKCα [blue signal] and detection of arciform densities in rod and cone synaptic terminals with a monoclonal antibody anti-Bassoon [red signal]. Note the remodeling of bipolar cell dendrites that is taking place at p40 in GCAPs−/−GCAP2+ samples associated to a reduction in the number and dimensions of synaptic ribbons and arciform density structures at rod and cone synaptic terminals.
Figure 5
Figure 5. Overexpression of GCAP2 in transgenic mice leads to shortening of ribbon length and to an increase in the fraction of club-shape and spherical morphologies representing disassembling ribbons.
A. Electron micrographs of rod synaptic terminals of dark-reared C57Bl, GCAP2+ or GCAP2+/+ mice at p40 that were processed in darkness or immediately after 1–5 h of light exposure, showing transversal sections of synaptic ribbons. Notice the difference in length in C57Bl [left], GCAP2+ [middle] and GCAP2+/+ [right panel] ribbons. In addition to synaptic vesicles, vesicle-like particles that are smaller in diameter than synaptic vesicles were seen forming clusters in the cytosol [GCAP2+/+ panel]. These clusters found in the vicinity of the ribbons were more extensive in GCAP2+/+ samples than in C57Bl samples. B. Club-shape ribbons were more abundant in GCAP2+ and GCAP2+/+ than in C57Bl samples. Two examples of the density of club-shape and spherical-ribbons are shown in 8,000× visual fields of GCAP2+ and GCAP2+/+ retinal sections. Club-shape and spherical ribbons pointed by arrows are shown at higher magnification in the right panels. C. Statistical analysis of ribbon length in C57Bl, GCAP2+ and GCAP2+/+ mice that were either raised in constant darkness (D); or raised in constant darkness and subsequently exposed to 1–5 h light (L). A minimum of forty synaptic ribbons were measured from at least two mice per phenotype. Plotted in the histogram are mean values ± standard error. *** denotes P<0.0001 in Student’s t-test. ** denotes P≤0,001 in Student’s t-test. *denotes PP≤0,01 in Student’s t-test. D. Statistical analysis of ribbon length in GCAP2+ and WT littermate control mice raised in standard cyclic light and processed at p60. GCAP2-expressing mice showed a 10% reduction in ribbon length compared to WT littermate controls. Notice the difference in the Y-axis scale. *** denotes P≤0,0001 in Student’s t-test. E. Histogram comparing the percentage of club-shape and spherical ribbons [of total synaptic ribbons] in C57Bl, GCAP2+ and GCAP2+/+ at p40 processed in darkness [D] or immediately after 1 h or 5 h of light exposure.
Figure 6
Figure 6. Immunoelectron microscopic localization of GCAP2 and Ribeye at rod synaptic terminals of GCAPs−/−GCAP2+ mice.
A. Localization of GCAP2 in ultrathin sections of the retina at the outer segment layer region, as an intrinsic control of the immunoelectron microscopic localization protocol. GCAP2 [5nm-gold particles, arrows] associates to the disc membranes, as expected. B-C. View of entire synaptic terminals, to show GCAP2 immunoreactivity sparsed in the cytosolic space and also associated to the plasma membrane, the membrane apposing invaginating horizontal processes and the ribbon. D. Gold-particles decorating the border of an invaginating horizontal process. E-G. Selected examples of longitudinal ribbons showing GCAP2 [5nm-gold particles in E, F, 15-nm gold particles in G, pointed by arrows in all panels] colocalizing with RIBEYE [arrowheads in all panels]. H-J. Selected ribbon transversal sections showing GCAP2 localization at the ribbon or its proximity [arrows point to GCAP2 associated particles, arrowheads to RIBEYE associated particles]. K, L. Representative examples of club-shape ribbon transversal sections, densely immunolabeled for Ribeye but not GCAP2. Scale bar corresponds to 200 nm in all panels.
Figure 7
Figure 7. Expression of GCAP2 in the absence of GCAP1 exacerbates the effect of GCAP2 at promoting ribbon disassembly.
A-C. Electron micrographs from WT (A), GCAPs−/− (B) and GCAPs−/−GCAP2+ (C) ultrathin retinal sections obtained from dark-reared mice at postnatal day 40, showing a representative rod synaptic ribbon from each phenotype. While GCAPs−/− mice show ribbons that are undistinguishable in length from wildtype ribbons, GCAPs−/−GCAP2+ mice show ribbons that are on average about 40% shorter than wildtype ribbons. hc: horizontal cell process; bc: bipolar cell process; sr: synaptic ribbon. D, E. Examples of GCAPs−/−GCAP2+ synaptic terminals containing accumulations of vesicle-like particles in the vicinity of the active zone (arrows). These aggregates, that might appear in terminals with or without ribbons, might generate as by-products in the bulk endocytosis for synaptic vesicle recycling process. F. Histogram of synaptic ribbon length in WT, GCAPs−/− and GCAPs−/−GCAP2+ mice. Plotted are mean values ± standard errors. * denotes P<0.001 in ANOVA analysis [F(2, 196532)  = 97,37, P = 0.000] using the PASW program package (IBM).
Figure 8
Figure 8. GCAP1 localizes to the synaptic terminal and partially overlaps with Ribeye.
Immunolabeling of vertical retinal sections from WT and GCAPs−/−GCAP2+ mice with rabbit polyclonal antibody anti-GCAP1 and a monoclonal antibody against Ribeye/CtBP2. GCAP1 is found at the outer segment (os) inner segment (is) and outer plexiform layer (opl) of the retina, where it colocalizes with Ribeye at synaptic ribbons (white arrows). GCAP1 antibody immunolabeling signal was absent in GCAPs−/−GCAP2+ sections when identical laser power and acquisition gain parameters were used at the confocal microscope, excluding that the signal originates from cross-reactivity of anti-GCAP1 antibody with GCAP2 at this working dilution.
Figure 9
Figure 9. Comparison of electroretinogram responses from WT, GCAP2+, GCAPs−/− and GCAPs−/−GCAP2+ mice that were either raised in constant darkness or in 12
h:12 h dark:light standard cyclic light. Left panel, superimposed representative responses of WT (red), GCAPs−/− (blue) and GCAPs−/−GCAP2+ (black) mice at p40 that were reared in constant darkness, in the scotopic and photopic range. The a-wave amplitude is severely reduced in GCAPs−/−GCAP2+ mice (black trace) compared to wildtype and GCAPs−/− traces in the scotopic range. This difference is absent in the photopic range, since the transgene is only expressed in rods. Central panel, superimposed representative responses of the same phenotypes, but raised in 12h:12h dark:light standard cyclic light and dark-adapted previous to the experiment. ERG responses from GCAPs−/−GCAP2+ mice were similar to GCAPs−/− and wildtype responses. Right panel, superimposed traces of cyclic light reared wildtype and GCAP2+ mice at p40. There were no statistically significant differences in the a-wave and b-wave amplitudes of these responses, whether the mice were raised in constant darkness or in 12h:12h dark:light standard cyclic light (cyclic reared mice results shown).

Similar articles

Cited by

References

    1. Werblin FS (2011) The retinal hypercircuit: a repeating synaptic interactive motif underlying visual function. J Physiol 589: 3691–3702. - PMC - PubMed
    1. Parsons TD, Sterling P (2003) Synaptic ribbon. Conveyor belt or safety belt? Neuron 37: 379–382. - PubMed
    1. Thoreson WB (2007) Kinetics of synaptic transmission at ribbon synapses of rods and cones. Mol Neurobiol 36: 205–223. - PMC - PubMed
    1. Prescott ED, Zenisek D (2005) Recent progress towards understanding the synaptic ribbon. Curr Opin Neurobiol 15: 431–436. - PubMed
    1. von Gersdorff H (2001) Synaptic ribbons: versatile signal transducers. Neuron 29: 7–10. - PubMed

Publication types

MeSH terms

Substances