. 2012;7(8):e43139.
doi: 10.1371/journal.pone.0043139. Epub 2012 Aug 17.

Pla2g12b and Hpn are genes identified by mouse ENU mutagenesis that affect HDL cholesterol

Affiliations

Pla2g12b and Hpn are genes identified by mouse ENU mutagenesis that affect HDL cholesterol

Aleksandra Aljakna et al. PLoS One. 2012.

Abstract

Despite considerable progress understanding genes that affect the HDL particle, its function, and cholesterol content, genes identified to date explain only a small percentage of the genetic variation. We used N-ethyl-N-nitrosourea mutagenesis in mice to discover novel genes that affect HDL cholesterol levels. Two mutant lines (Hlb218 and Hlb320) with low HDL cholesterol levels were established. Causal mutations in these lines were mapped using linkage analysis: for line Hlb218 within a 12 Mbp region on Chr 10; and for line Hlb320 within a 21 Mbp region on Chr 7. High-throughput sequencing of Hlb218 liver RNA identified a mutation in Pla2g12b. The transition of G to A leads to a cysteine to tyrosine change and most likely causes a loss of a disulfide bridge. Microarray analysis of Hlb320 liver RNA showed a 7-fold downregulation of Hpn; sequencing identified a mutation in the 3' splice site of exon 8. Northern blot confirmed lower mRNA expression level in Hlb320 and did not show a difference in splicing, suggesting that the mutation only affects the splicing rate. In addition to affecting HDL cholesterol, the mutated genes also lead to reduction in serum non-HDL cholesterol and triglyceride levels. Despite low HDL cholesterol levels, the mice from both mutant lines show similar atherosclerotic lesion sizes compared to control mice. These new mutant mouse models are valuable tools to further study the role of these genes, their affect on HDL cholesterol levels, and metabolism.


Conflict of interest statement

Competing Interests: The authors have declared that no competing interests exist.

Figures

Figure 1
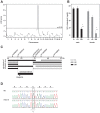
Figure 1. Identification of the mutation in C57BL/6J-Pla2g12bHlb218/J on Chr 10.
[A] Linkage analysis of (Hlb218×C57L) F2 animals for plasma HDL cholesterol levels showed a significant linkage on Chr 10; LOD score of 11.8 at α = 0.05. [B] Mean plasma HDL cholesterol values (HDL-C±SEM) by genotype and sex in the F2 population at peak marker rs13480619 (*significant difference compared to LL (P<0.001); **significant difference compared to LB (P<0.001)). [C] Genotyping for additional SNP markers in F2 animals with low HDL cholesterol level and recombination in the mapped region narrowed the region with the mutation to 11.73 Mbp (between dashed vertical lines). Triangles above the upper black line are markers; numbers below the line represent the physical Mb location on Chr 10 (NCBI, mm9). [D] Chromatographs of genomic DNA sequence of the Hlb218 mouse versus the B6 control. The open rectangle highlights the transition of G to A in exon 3 of Pla2g12b. Corresponding amino acids are shown by the appropriate single letter code above the chromatographs.
Figure 2
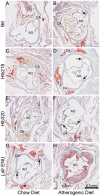
Figure 2. Comparison of atherosclerotic lesion size between mutant lines and B6.
Hypolipidemic 20-week-old ENU females (Hlb218 and Hlb320) showed similar susceptibility to atherosclerosis (lesion formation) as age-matched B6 females on chow (panels C and E vs. A) and atherogenic diet (panels D and F vs. B). All cross sections of the 300-µm area above the aortic root, where coronary arteries (CA) and ascending aorta (AO) join, were compared (n = 5 females per strain for each diet; 2.5× magnification). Cross sections were stained with oil red O and counterstained with Mayer's hematoxilin. The figure shows representative cross sections from selected females. The black arrow points to areas with lesion formation. Cross sections from Ldlr ENU (panels G and H) were included as a positive control.
Figure 3
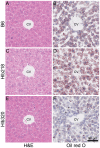
Figure 3. Histological comparison of liver from mutant lines and B6.
Livers from 20-week-old Hlb218, Hlb320, and B6 females fed chow diet were collected. Liver cross sections from 5 females of each strain were stained with H&E and oil red O and compared. The figure shows representative liver sections from selected females. A, C, E — H&E stain; B, D, F — oil red O stain with Mayer's hematoxylin counterstain. Hlb218 mice showed increased liver lipid level. CV – central vein.
Figure 4
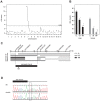
Figure 4. Identification of the mutation in C57BL/6J-HpnHlb320/J on Chr 7.
[A] Linkage analysis of (Hlb320×C57L) F2 animals for plasma HDL cholesterol levels showed a significant linkage on Chr 7; LOD score of 12.4 at α = 0.05. [B] Mean plasma HDL cholesterol values (HDL-C±SEM) by genotype and sex in the F2 population at peak marker rs4226386 (*significant difference compared to LL (P<0.0001); **significant difference compared to LB (P<0.01)). [C] Genotyping for additional SNP markers in F2 animals with low HDL cholesterol level and recombination in the mapped region narrowed the region with the mutation to 21.2 Mbp (between dashed vertical lines). Triangles above the upper black line are markers; numbers below the line represent the physical Mb location on Chr 7 (NCBI, mm9). [D] Chromatographs of genomic DNA sequence of the Hlb320 mouse versus the B6 control. The open rectangle highlights the transition of T to C in the second base pair in the 3′ splice site of exon 8 of Hpn.
Figure 5
Figure 5. Northern blot analysis of Hpn mRNA expression.
Total liver RNA from B6 and Hlb320 mice was hybridized with a mouse Hpn oligo probe and β-actin probe (loading control). The mRNA length of Hpn in B6 and Hlb320 was the same, while liver expression was relatively lower in Hlb320 compared to B6.
Figure 6
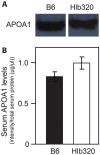
Figure 6. Serum APOA1 level in Hlb320 and B6.
Western blot analysis showed similar serum APOA1 levels in Hlb320 (n = 4) and B6 (n = 4) male mice (P = 0.15). [A] Serum APOA1; bands from the western blot from representative animals. [B] Statistical comparison of quantified serum APOA1 level. The intensity of the APOA1 protein band for each animal was quantified and then normalized by the total serum protein concentration (µg/µl) in the sample from that animal. Normalized serum APOA1 level is expressed as mean±SEM.
Figure 7
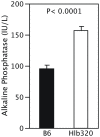
Figure 7. Serum alkaline phosphatase level in Hlb320 and B6.
Serum total alkaline phosphatase (ALP) level in Hlb320 males (n = 5) was significantly higher than in B6 males (n = 5; P<0.0001). Total ALP activity is expressed as mean±SEM.
Figure 8
Figure 8. Comparison of hearing ability in Hlb320 and B6.
Homozygous Hlb320 (n = 5) males had significantly lower hearing ability than age-matched B6 control males (n = 5) at 8 kHz, 16 kHz, and 32 kHz. Auditory brainstem response (ABR) threshold values (in dB SPL) are shown as mean±SEM for each auditory stimulus frequency (kHz).

References

    1. Lopez AD, Mathers CD, Ezzati M, Jamison DT, Murray CJ (2006) Global and regional burden of disease and risk factors, 2001: systematic analysis of population health data. Lancet 367: 1747–1757. - PubMed
    1. Mathers CD, Loncar D (2006) Projections of global mortality and burden of disease from 2002 to 2030. PLoS Med 3: e442. - PMC - PubMed
    1. Ward JR, Wilson HL, Francis SE, Crossman DC, Sabroe I (2009) Translational mini-review series on immunology of vascular disease: inflammation, infections and Toll-like receptors in cardiovascular disease. Clin Exp Immunol 156: 386–394. - PMC - PubMed
    1. Lloyd-Jones D, Adams RJ, Brown TM, Carnethon M, Dai S, et al. (2010) Executive summary: heart disease and stroke statistics–2010 update: a report from the American Heart Association. Circulation 121: 948–954. - PubMed
    1. Toth PP (2007) Reducing cardiovascular risk by targeting high-density lipoprotein cholesterol. Curr Atheroscler Rep 9: 81–88. - PubMed

Publication types

MeSH terms