

Risk stratification of latent tuberculosis defined by combined interferon gamma release assays
- PMID: 22912846
- PMCID: PMC3422279
- DOI: 10.1371/journal.pone.0043285
Risk stratification of latent tuberculosis defined by combined interferon gamma release assays
Abstract
Background: Most individuals infected with Mycobacterium tuberculosis develop latent tuberculosis infection (LTBI). Some may progress to active disease and would benefit from preventive treatment yet no means currently exists to predict who will reactivate. Here, we provide an approach to stratify LTBI based on IFN-γ responses to two antigens, the recombinant Early-Secreted Antigen Target-6 (rESAT-6) and the latency antigen Heparin-Binding Haemagglutinin (HBHA).
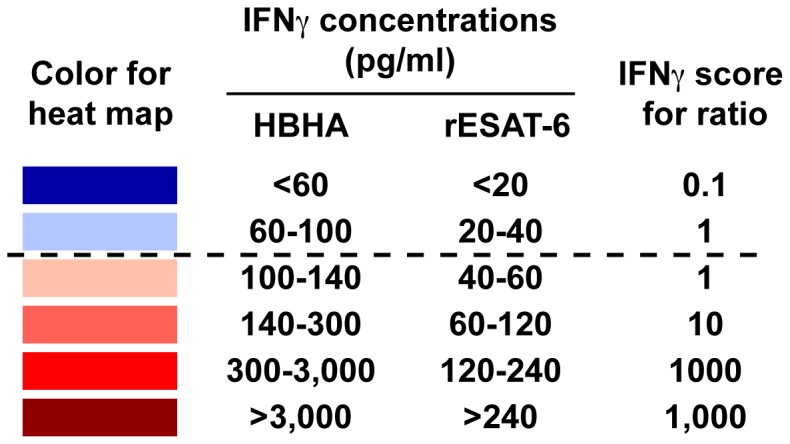
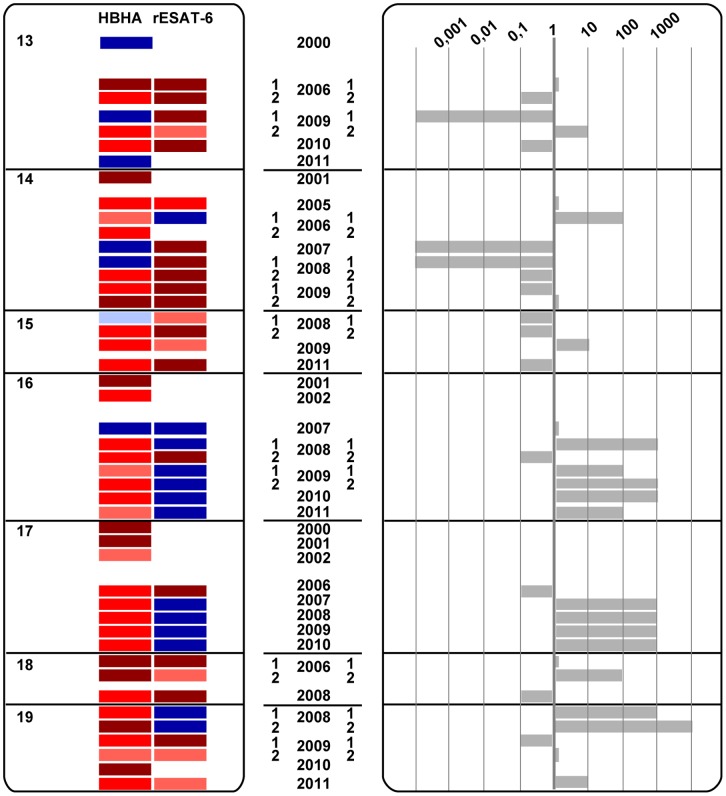
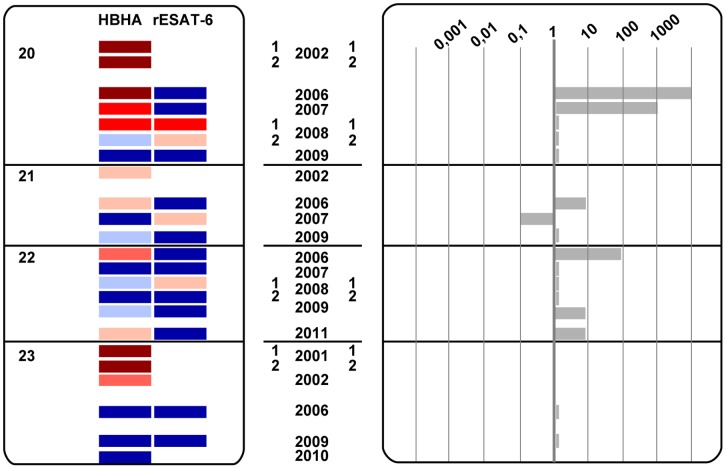
Methods: We retrospectively analyzed results from in-house IFN-γ-release assays with HBHA (HBHA-IGRA) and rESAT-6 (rESAT-6-IGRA) performed during a 12-year period on serial blood samples (3 to 9) collected from 23 LTBI subjects in a low-TB incidence country. Both the kinetics of the absolute IFN-γ concentrations secreted in response to each antigen and the dynamics of HBHA/rESAT-6-induced IFN-γ concentrations ratios were examined.
Results: This analysis allowed the identification among the LTBI subjects of three major groups. Group A featured stable HBHA and rESAT-6-IGRA profiles with an HBHA/rESAT-6 ratio persistently higher than 1, and with high HBHA- and usually negative rESAT-6-IGRA responses throughout the study. Group B had changing HBHA/rESAT-6 ratios fluctuating from 0.0001 to 10,000, with both HBHA and rESAT-6 responses varying over time at least once during the follow-up. Group C was characterized by a progressive disappearance of all responses.
Conclusions: By combining the measures of IFN-γ concentrations secreted in response to an early and a latency antigens, LTBI subjects can be stratified into different risk groups. We propose that disappearing responses indicate cure, that persistent responses to HBHA with HBHA/rESAT-6 ratios ≥ 1 represent stable LTBI subjects, whereas subjects with ratios varying from >1 to <1 should be closely monitored as they may represent the highest-risk group, as illustrated by a case report, and should therefore be prioritized for preventive treatment.
Conflict of interest statement
Figures


Similar articles
-
Optimal Detection of Latent Mycobacterium tuberculosis Infection by Combined Heparin-Binding Hemagglutinin (HBHA) and Early Secreted Antigenic Target 6 (ESAT-6) Whole-Blood Interferon Gamma Release Assays.J Clin Microbiol. 2022 May 18;60(5):e0244321. doi: 10.1128/jcm.02443-21. Epub 2022 Apr 18. J Clin Microbiol. 2022. PMID: 35430897 Free PMC article.
-
Mycobacterial heparin-binding hemagglutinin (HBHA)-induced interferon-γ release assay (IGRA) for discrimination of latent and active tuberculosis: A systematic review and meta-analysis.PLoS One. 2021 Jul 16;16(7):e0254571. doi: 10.1371/journal.pone.0254571. eCollection 2021. PLoS One. 2021. PMID: 34270559 Free PMC article.
-
Contribution of a heparin-binding haemagglutinin interferon-gamma release assay to the detection of Mycobacterium tuberculosis infection in HIV-infected patients: comparison with the tuberculin skin test and the QuantiFERON-TB Gold In-tube.BMC Infect Dis. 2015 Feb 14;15:59. doi: 10.1186/s12879-015-0796-0. BMC Infect Dis. 2015. PMID: 25886172 Free PMC article.
-
QuantiFERON-TB Gold Plus combined with HBHA-Induced IFN-γ release assay improves the accuracy of identifying tuberculosis disease status.Tuberculosis (Edinb). 2020 Sep;124:101966. doi: 10.1016/j.tube.2020.101966. Epub 2020 Aug 6. Tuberculosis (Edinb). 2020. PMID: 32866942
-
[Evolution of IGRA researches].Kekkaku. 2008 Sep;83(9):641-52. Kekkaku. 2008. PMID: 18979999 Review. Japanese.
Cited by
-
Heparin-binding haemagglutinin, a new tool for the detection of latent Mycobacterium tuberculosis infection in hemodialysis patients.PLoS One. 2013 Aug 5;8(8):e71088. doi: 10.1371/journal.pone.0071088. Print 2013. PLoS One. 2013. PMID: 23940693 Free PMC article.
-
The pathogenesis of post-primary tuberculosis. A game changer for vaccine development.Tuberculosis (Edinb). 2019 May;116S:S114-S117. doi: 10.1016/j.tube.2019.04.018. Epub 2019 Apr 26. Tuberculosis (Edinb). 2019. PMID: 31076321 Free PMC article. Review.
-
Tuberculosis Transmission in a Primary School and a Private Language School. An Estimation of Infectivity.Front Pediatr. 2020 Feb 7;8:10. doi: 10.3389/fped.2020.00010. eCollection 2020. Front Pediatr. 2020. PMID: 32117825 Free PMC article.
-
Rifamycins (rifampicin, rifabutin and rifapentine) compared to isoniazid for preventing tuberculosis in HIV-negative people at risk of active TB.Cochrane Database Syst Rev. 2013 Jul 5;2013(7):CD007545. doi: 10.1002/14651858.CD007545.pub2. Cochrane Database Syst Rev. 2013. PMID: 23828580 Free PMC article.
-
T-cell immunophenotyping distinguishes active from latent tuberculosis.J Infect Dis. 2013 Sep;208(6):952-68. doi: 10.1093/infdis/jit265. J Infect Dis. 2013. PMID: 23966657 Free PMC article.
References
-
- Dye C, Williams BG (2010) The population dynamics and control of tuberculosis. Science 328: 856–861. - PubMed
-
- Wilkinson D (2000) Drugs for preventing tuberculosis in HIV infected persons. Cochrane Database Syst Rev 4: CD000171. - PubMed
-
- Solovic I, Sester M, Gomez-Reino JJ, Rieder HL, Ehlers S, et al. (2010) The risk of tuberculosis related to tumour necrosis factor antagonist therapies: a TBNET consensus statement. Eur Respir J 36: 1185–1206. - PubMed
-
- Cengiz K (1996) Increased incidence of tuberculosis in patients undergoing hemodialysis. Nephron 73: 421–424. - PubMed
Publication types
MeSH terms
Substances
LinkOut - more resources
Full Text Sources
