High expression of nuclear factor 90 (NF90) leads to mitochondrial degradation in skeletal and cardiac muscles
- PMID: 22912857
- PMCID: PMC3422296
- DOI: 10.1371/journal.pone.0043340
High expression of nuclear factor 90 (NF90) leads to mitochondrial degradation in skeletal and cardiac muscles
Abstract
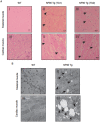
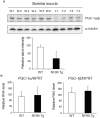
While NF90 has been known to participate in transcription, translation and microRNA biogenesis, physiological functions of this protein still remain unclear. To uncover this, we generated transgenic (Tg) mice using NF90 cDNA under the control of β-actin promoter. The NF90 Tg mice exhibited a reduction in body weight compared with wild-type mice, and a robust expression of NF90 was detected in skeletal muscle, heart and eye of the Tg mice. To evaluate the NF90 overexpression-induced physiological changes in the tissues, we performed a number of analyses including CT-analysis and hemodynamic test, revealing that the NF90 Tg mice developed skeletal muscular atrophy and heart failure. To explore causes of the abnormalities in the NF90 Tg mice, we performed histological and biochemical analyses for the skeletal and cardiac muscles of the Tg mice. Surprisingly, these analyses demonstrated that mitochondria in those muscular tissues of the Tg mice were degenerated by autophagy. To gain further insight into the cause for the mitochondrial degeneration, we identified NF90-associated factors by peptide mass fingerprinting. Of note, approximately half of the NF90-associated complexes were ribosome-related proteins. Interestingly, protein synthesis rate was significantly suppressed by high-expression of NF90. These observations suggest that NF90 would negatively regulate the function of ribosome via its interaction with the factors involved in the ribosome function. Furthermore, we found that the translations or protein stabilities of PGC-1 and NRF-1, which are critical transcription factors for expression of mitochondrial genes, were significantly depressed in the skeletal muscles of the NF90 Tg mice. Taken together, these findings suggest that the mitochondrial degeneration engaged in the skeletal muscle atrophy and the heart failure in the NF90 Tg mice may be caused by NF90-induced posttranscriptional repression of transcription factors such as PGC-1 and NRF-1 for regulating nuclear-encoded genes relevant to mitochondrial function.
Conflict of interest statement
Figures


Similar articles
-
Overexpression of NF90-NF45 Represses Myogenic MicroRNA Biogenesis, Resulting in Development of Skeletal Muscle Atrophy and Centronuclear Muscle Fibers.Mol Cell Biol. 2015 Jul;35(13):2295-308. doi: 10.1128/MCB.01297-14. Epub 2015 Apr 27. Mol Cell Biol. 2015. PMID: 25918244 Free PMC article.
-
NF90 regulates cell cycle exit and terminal myogenic differentiation by direct binding to the 3'-untranslated region of MyoD and p21WAF1/CIP1 mRNAs.J Biol Chem. 2005 May 13;280(19):18981-9. doi: 10.1074/jbc.M411034200. Epub 2005 Mar 3. J Biol Chem. 2005. PMID: 15746098
-
ALDH2 restores exhaustive exercise-induced mitochondrial dysfunction in skeletal muscle.Biochem Biophys Res Commun. 2017 Apr 15;485(4):753-760. doi: 10.1016/j.bbrc.2017.02.124. Epub 2017 Feb 27. Biochem Biophys Res Commun. 2017. PMID: 28249782
-
The Polyvalent Role of NF90 in RNA Biology.Int J Mol Sci. 2022 Nov 5;23(21):13584. doi: 10.3390/ijms232113584. Int J Mol Sci. 2022. PMID: 36362366 Free PMC article. Review.
-
Mitochondrial dysregulation and muscle disuse atrophy.F1000Res. 2019 Sep 11;8:F1000 Faculty Rev-1621. doi: 10.12688/f1000research.19139.1. eCollection 2019. F1000Res. 2019. PMID: 31559011 Free PMC article. Review.
Cited by
-
Overexpression of NF90-NF45 Represses Myogenic MicroRNA Biogenesis, Resulting in Development of Skeletal Muscle Atrophy and Centronuclear Muscle Fibers.Mol Cell Biol. 2015 Jul;35(13):2295-308. doi: 10.1128/MCB.01297-14. Epub 2015 Apr 27. Mol Cell Biol. 2015. PMID: 25918244 Free PMC article.
-
Extracellular Vesicles From Liver Progenitor Cells Downregulates Fibroblast Metabolic Activity and Increase the Expression of Immune-Response Related Molecules.Front Cell Dev Biol. 2021 Jan 12;8:613583. doi: 10.3389/fcell.2020.613583. eCollection 2020. Front Cell Dev Biol. 2021. PMID: 33511119 Free PMC article.
-
NF90-NF45 is essential for β cell compensation under obesity-inducing metabolic stress through suppression of p53 signaling pathway.Sci Rep. 2022 May 25;12(1):8837. doi: 10.1038/s41598-022-12600-y. Sci Rep. 2022. PMID: 35614067 Free PMC article.
References
-
- Saunders LR, Barber GN (2003) The dsRNA binding protein family: critical roles, diverse cellular functions. FASEB J. 17: 961–983. - PubMed
-
- Krol J, Loedige I, Filipowicz W (2010) The widespread regulation of microRNA biogenesis, function and decay. Nat Rev Genet. 11: 597–610. - PubMed
-
- Kao PN, Chen L, Brock G, Ng J, Kenny J, et al. (1994) Cloning and expression of cyclosporin A- and FK506-sensitive nuclear factor of activated T-cells: NF45 and NF90. J Biol Chem 269: 20691–20699. - PubMed
Publication types
MeSH terms
Substances
LinkOut - more resources
Full Text Sources
Molecular Biology Databases
Miscellaneous

