. 2012 Oct;117(4):857-67.
doi: 10.1097/ALN.0b013e31826a8a13.

Quantitative changes in regional cerebral blood flow induced by cold, heat and ischemic pain: a continuous arterial spin labeling study

Affiliations

Quantitative changes in regional cerebral blood flow induced by cold, heat and ischemic pain: a continuous arterial spin labeling study

Michael A Frölich et al. Anesthesiology. 2012 Oct.

Abstract

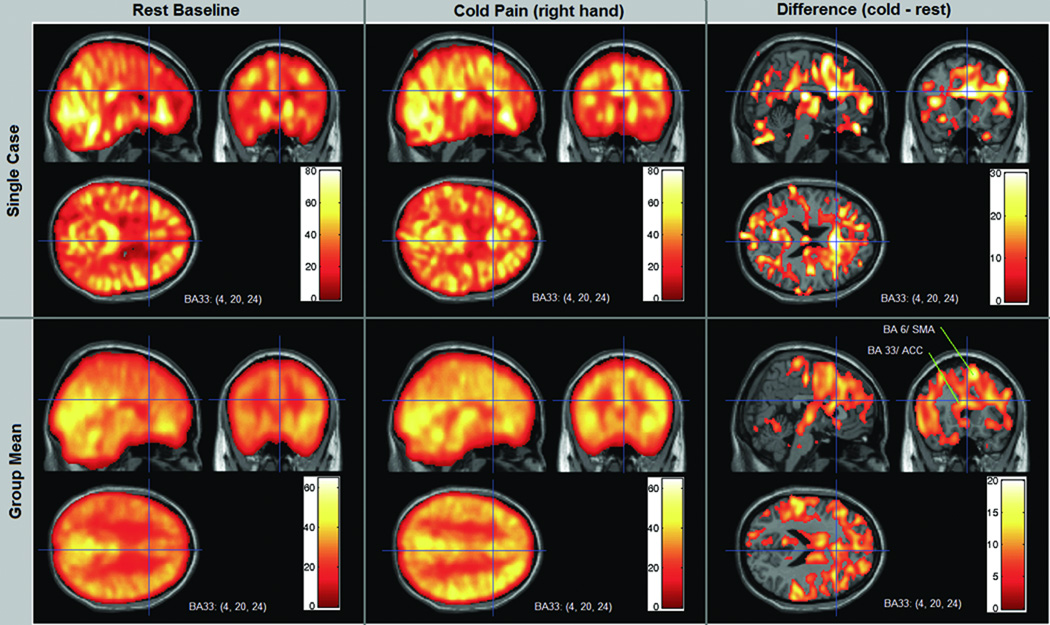
Background: The development of arterial spin labeling methods has allowed measuring regional cerebral blood flow (rCBF) quantitatively and to show the pattern of cerebral activity associated with any state such as a sustained pain state or changes due to a neurotropic drug.

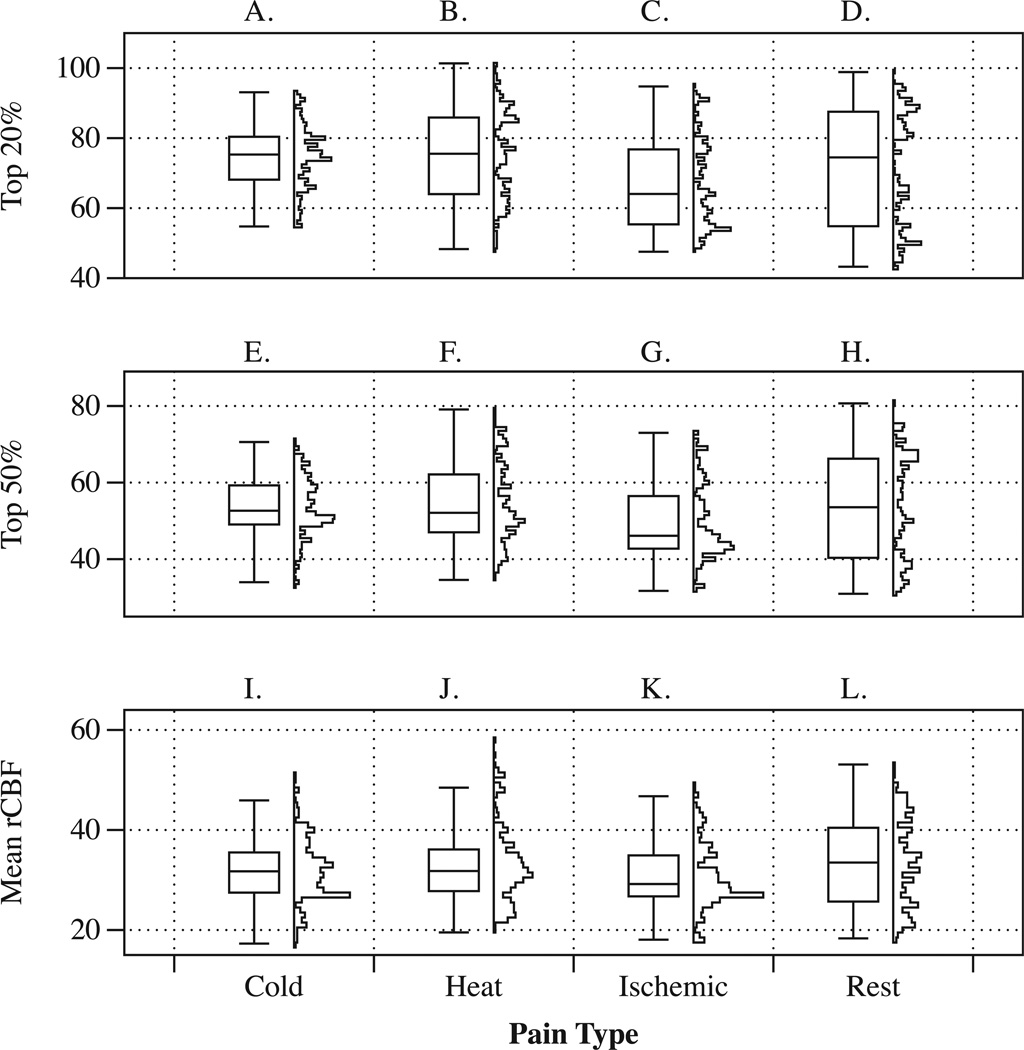
Methods: The authors studied the differential effects of three pain conditions in 10 healthy subjects on a 3 Tesla scanner during resting baseline, heat, cold, and ischemic pain using continuous arterial spin labeling.

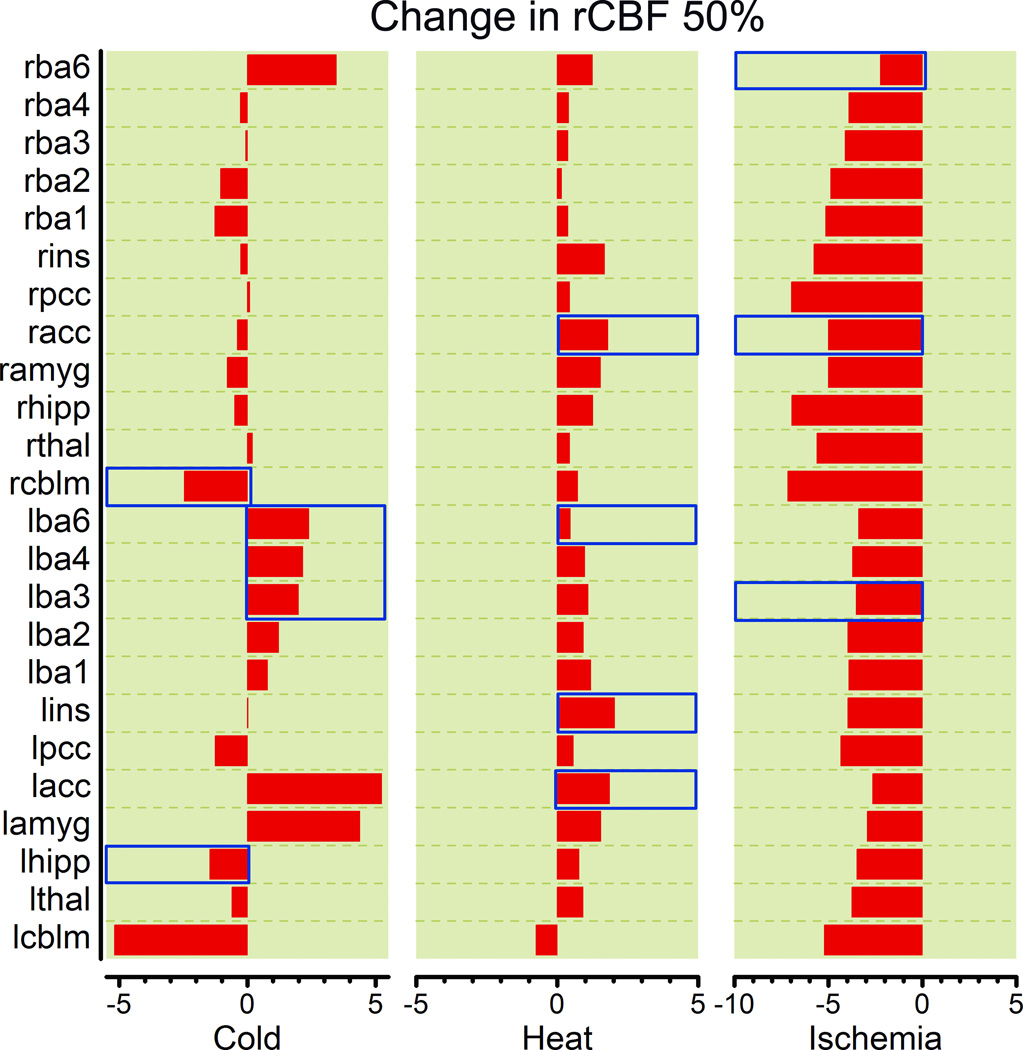
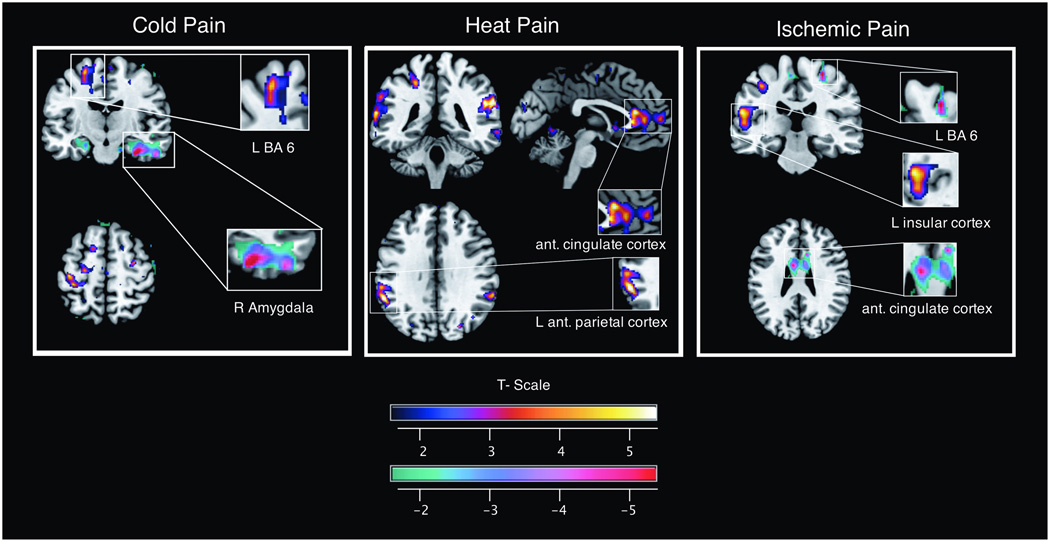
Results: Cold pain showed the greatest absolute rCBF increases in left anterior cingulate cortex, left amygdala, left angular gyrus, and Brodmann area 6, and a significant rCBF decrease in the cerebellum. Changes in rCBF were characteristic of the type of pain condition: cold and heat pain showed increases, whereas the ischemic condition showed a reduction in mean absolute gray matter flow compared with rest. An association of subjects' pain tolerance and cerebral blood flow was noted.

Conclusions: The observation that quantitative rCBF changes are characteristic of the pain task used and that there is a consistent rCBF change in Brodman area 6, an area responsible for the integration of a motor response to pain, should provide extremely useful information in the quest to develop an imaging biomarker of pain. Conceivably, response in BA6 may serve as an objective measure of analgesic efficacy.


Figures

Figure 1
Figure 1
The figure shows corresponding boxplots and vertical histograms of rCBF values calculated separately for each region of interest and each participant. Panels A to D illustrate summary plots for the top 20% blood flow data. Panels E to H illustrate summary plots for the top 50% blood flow data and Panels I to L illustrate summary plots for the top mean (average) blood flow data. The categorical axis (x-axis) shows experimental conditions. Regions of interest included were BA 1–4, BA 6 insular and cingulate cortex, amygdala, hippocampus, thalamus and cerebellum. rCBF: regional cereral blood flow; BA: Brodman area.
Figure 2
Figure 2
Average regional cerebral blood flow values in ROIs using the top 50% voxel selection filter. Areas that can also be identified in the by the SMP analysis that was not restricted to pain ROIs are marked with a transparent red overlay bar. ROI: region of interest; rCBF: regional cerebral blood flow.
Figure 3
Figure 3
CASL rCBF images for a single case and for the mean of all 10 cases during Rest and the Cold Pain condition. In this example the crosshairs and corresponding orthogonal slices are centered on the anterior cingulate cortex (ACC), Montreal Neurology Institute coordinates x= 4, y=20, z=24. The group images were created from the mean of 10 motion corrected individual case image sets, spatially normalized into stereotactic space. Color bar scales indicate rCBF in ml/100g/min. Increased rCBF is evident in the ACC during cold pain by visual inspection of the case example (the actual rCBF increases from 49.6 at rest to 72.9 at the coordinate center voxel). The group mean images show that this increase is evident across subjects, both by visual inspection and quantitative values (group mean rCBF increases from 41.9 to 57.4 at the coordinate center voxel). The difference images on the right side were created by subtracting the resting baseline rCBF values from the cold pain rCBF values in all voxels. The ACC (BA 33) appears as the area of greatest flow increase in these coordinate planes, along with part of the supplementary motor cortex (BA 6) in these planes shown. The lower right panel identifies these two regions in the mean group subtraction. CASL: continuous arterial spin labeling; rCBF: regional cerebral blood flow; BA: Brodman area.
Figure 4
Figure 4
Representative maps of increased and decreased rCBF for the cold pain, heat pain, and ischemic pain condition based on the SPM analysis. Relative signal change are coded using the NIH-fire color scheme (upper bar) for increase and the NIH-ice color scheme for rCBF reduction (lower bar). rCBF: regional cerebral blood flow; SPM: statistical parametric mapping; NIH: National Institute of Health; BA: Brodman area.

References

    1. Tracey I. Imaging pain. Br J Anaesth. 2008;101:32–39. - PubMed
    1. Bingel U, Tracey I. Imaging CNS modulation of pain in humans. Physiology (Bethesda) 2008;23:371–380. - PubMed
    1. Byas-Smith M, Frolich MA, Votaw JR, Faber TL, Hoffman JM. Cerebral blood flow during propofol induced sedation. Mol Imaging Biol. 2002;4:139–146. - PubMed
    1. Barbier EL, Lamalle L, Decorps M. Methodology of brain perfusion imaging. J Magn Reson Imaging. 2001;13:496–520. - PubMed
    1. Detre JA, Leigh JS, Williams DS, Koretsky AP. Perfusion imaging. Magn Reson Med. 1992;23:37–45. - PubMed

Publication types