. 2012 Oct;23(7):678-92.
doi: 10.1097/FBP.0b013e328358593c.

Role of µ-opioid receptor reserve and µ-agonist efficacy as determinants of the effects of µ-agonists on intracranial self-stimulation in rats

Affiliations

Role of µ-opioid receptor reserve and µ-agonist efficacy as determinants of the effects of µ-agonists on intracranial self-stimulation in rats

Ahmad A Altarifi et al. Behav Pharmacol. 2012 Oct.

Abstract

The net effect of µ-opioid receptor agonists on intracranial self-stimulation (ICSS) in rats reflects an integration of rate-increasing and rate-decreasing effects. Previous opioid exposure is associated with tolerance to rate-decreasing effects and the augmented expression of abuse-related rate-increasing effects. This finding was replicated here with morphine. Subsequent studies then tested the hypothesis that opioid agonist-induced rate-decreasing effects require the activation of a larger relative fraction of µ receptors, and hence are more vulnerable to tolerance-associated reductions in receptor density than rate-increasing effects. Two sets of experiments were conducted to test this hypothesis. First, the effects of morphine on ICSS were examined after pretreatment with the irreversible µ antagonist β-funaltrexamine to reduce the density of available µ receptors. Second, effects were examined for a range of µ opioids that varied in relative efficacy at µ receptors. The hypothesis predicted that (a) morphine, after β-funaltrexamine treatment, or (b) low-efficacy µ agonists would mimic the effects of morphine tolerance to produce the reduced expression of rate-decreasing effects and enhanced expression of rate-increasing effects. Neither of these predictions were supported. These results indicate that µ agonist-induced facilitation and depression of ICSS may be mediated by distinct populations of µ receptors that respond differently to regimens of opioid exposure.


Conflict of interest statement

Conflicts of Interest: None declared.

Figures
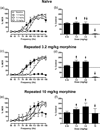
Fig. 1
Fig. 1
Effects of repeated morphine on cumulative morphine dose-effect curves. Cumulative morphine dose effect curves were determined before repeated daily morphine administration (a,b), following six days of repeated daily administration of 3.2 mg/kg morphine (c,d), and six days of repeated daily administration of 10 mg/kg morphine (e,f). The left column of panels (a, c, and e) displays ICSS frequency-rate curves. Horizontal axes: frequency of electrical brain stimulation in hertz (log scale). Vertical axes: ICSS rate expressed as percent maximum control rate (%MCR). Data obtained for 0.32 mg/kg morphine, which had no effect under any conditions tested, are omitted from the graph for clarity but were included in statistical analysis. Filled symbols indicate frequencies at which morphine ICSS rates were greater than those obtained during control components, as determined by the Holm-Sidak post-hoc test following a significant two-way ANOVA. The right column of panels (b, d, and f) displays the total number of stimulations per test component expressed as a percentage of total control stimulations. Horizontal axes: dose of morphine. Vertical axes: percent control stimulations per test component. Upward and downward arrows indicate the presence and valence of effects of morphine as determined by analyses of frequency-rate data. Thus, upward arrows indicate significant facilitation of ICSS at ≥1 frequency of the frequency-rate curve, whereas downward arrows indicate significant depression of ICSS at ≥1 frequency of the frequency-rate curve. ANOVA results were as follows: Naive: Significant main effect of frequency [F(9,36)=60.1; P<0.001], significant main effect of dose [F(4,16)=46.3; P<0.001], and significant dose X frequency interaction [F(36,144)=13.2; P<0.001]; Repeated 3.2 mg/kg/day: Significant main effect of frequency [F(9,36)=50.6; P<0.001], significant main effect of dose [F (4,16)=60.7; P<0.001], and significant dose X frequency interaction [F(36,144)=9.4; P<0.001]; Repeated 10.0 mg/kg/day: Significant main effect of frequency [F(9,36)=30.8; P<0.001], no significant main effect of dose [F(4,16)=1.8; NS], and significant dose X frequency interaction [F(36,144)=4.5; P<0.001]. All points show mean ± SEM for five rats.
Fig. 2
Fig. 2
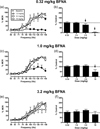
Effects of β-FNA on cumulative morphine dose-effect curves. Cumulative morphine dose effect curves were determined 24 hours after administration of 0.32 mg/kg (a,b), 1.0 mg/kg (c,d), or 3.2 mg/kg β-FNA (e,f). ANOVA results were as follows: 0.32 mg/kg β-FNA: Significant main effect of frequency [F(9,36)=20.7; P<0.001], significant main effect of dose [F(4,16)=36.1; P<0.001], and significant dose X frequency interaction [F(36,144)=7.9; P<0.001]; 1.0 mg/kg β-FNA: Significant main effect of frequency [F(9,36)=55.0; P<0.001], significant main effect of dose [F(4,16)=5.9; P<0.01], and significant dose X frequency interaction [F(36,144)=5.9; P<0.001]; 3.2mg/kg β-FNA : Significant main effect of frequency [F(9,36)=33.7; P<0.001], no significant main effect of dose [F(4,16)=1.2; NS], and no significant dose X frequency interaction [F(36,144)=1.1; NS]. For description of axes and symbols, please refer to figure 1. All points show mean ± SEM for five rats.
Fig. 3
Fig. 3
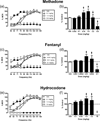
Effects of the high-efficacy µ opioid receptor ligands methadone (a,b), fentanyl (c,d), or hydrocodone (e,f) on ICSS in opioid-experienced rats. ANOVA results were as follows: Methadone: Significant main effect of frequency [F(9,36)=71.2; P<0.001], significant main effect of dose [F(5,20)=3.8; P=0.014], and significant dose X frequency interaction [F(45,180)=3.8; P<0.001]; Fentanyl: Significant main effect of frequency [F(9,36)=39.7; P<0.001], significant main effect of dose [F(5,20)=9.8; P<0.001], and significant dose X frequency interaction [F(45,180)=5.4; P<0.001]; Hydrocodone: Significant main effect of frequency [F(9,36)=75.1; P<0.001], significant main effect of dose [F(5,20)=19.0; P<0.001], and significant dose X frequency interaction [F(45,180)=3.9; P<0.001]. For description of axes and symbols, please refer to figure 1.
Fig. 4
Fig. 4
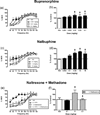
Effects of low-efficacyµ-opioid receptor ligands buprenorphine (a,b) and nalbuphine (c,d) and the opioid antagonist naltrexone ± methadone (e,f) on ICSS in opioid-experienced rats. ANOVA results were as follows: Buprenorphine: Significant main effect of frequency [F(9,36)=62.8; P<0.001], no significant main effect of dose [F(5,20)=0.8; P=0.543], and significant dose X frequency interaction [F(45,180)=2.8; P<0.001]; Nalbuphine: Significant main effect of frequency [F(9,36)=27.1; P<0.001], significant main effect of dose [F(5,20)=10.8; P<0.001], and significant dose X frequency interaction [F(45,180)=1.8; P=0.005]; Naltrexone: Significant main effect of frequency [F(9,27)=27.4; P<0.001], significant main effect of treatment [F(3,9)=7.1; P=0.009], and significant treatment X frequency interaction [F(27,81)=3.5; P<0.001]. For description of axes and symbols, please refer to figure 1.
Fig. 5
Fig. 5
Time courses of µ-opioid receptor agonist effects on ICSS. Time course of the dose producing peak facilitation of ICSS for each drug as shown in figures 3 and 4 was determined. Horizontal axes: time elapsed after injection of test drug. Vertical axes: percent control stimulations per test component. ANOVA results were as follows: Methadone: Significant main effect of frequency [F(9,36)=92.8; P<0.001], significant main effect of time [F(6,24)=15.1; P<0.001], and significant time X frequency interaction [F(45,216)=2.2; P<0.001]; Fentanyl: Significant main effect of frequency [F(9,27)=37.5; P<0.001], significant main effect of time [F(6,18)=13.3; P<0.001], and no significant time X frequency interaction [F(54,162)=1.3; P=0.122]; Hydrocodone: Significant main effect of frequency [F(9,36)=57.5; P<0.001], significant main effect of time [F(6,24)=36.3; P<0.001], and significant time X frequency interaction [F(45,216)=3.1; P<0.001]; Buprenorphine: Significant main effect of frequency [F(9,27)=28.6; P<0.001], significant main effect of time [F(6,18)=7.6; P<0.001], and no significant time X frequency interaction [F(54,162)=1.0; P=0.545]; Nalbuphine: Significant main effect of frequency [F(9,27)=36.5; P<0.001], significant main effect of time [F(5,15)=7.8; P<0.001], and no significant time X frequency interaction [F(45,135)=1.2; P=0.181]; Vehicle: Significant main effect of frequency [F(9,27)=36.7; P<0.001], no significant main effect of time [F(6,18)=1.6; P=0.215], and no significant time X frequency interaction [F(54,162)=1.2; P=0.250]. For description of symbols, please refer to figure 1.
Fig. 6
Fig. 6
Time course of effects produced by 1.0 mg/kg buprenorphine on ICSS. The left panel (a) displays ICSS frequency-rate curves. Horizontal axes: frequency of electrical brain stimulation in hertz (log scale). Data from 10, 180 min, and 24 h are not shown in frequency-rate graph (a) for clarity, but they were included in statistical analysis. The right panel (b) displays the total number of stimulations per test component expressed as a percentage of total control stimulations. There was significant main effect of frequency [F(9,45)=28.6; P<0.001], no significant main effect of time [F(6,30)=1.6; P=0.179], and significant time X frequency interaction [F(54,270)=3.4; P<0.001]. For description of axes and symbols, please refer to figure 1.
Fig. 7
Fig. 7
Effects of morphine alone, nalbuphine alone, or morphine plus nalbuphine on ICSS. Horizontal axes: dose of test drug. There was significant main effect of frequency[F(9,27)=24.3; P<0.001], significant main effect of treatment [F(3,9)=54.5.6; P<0.001], and significant treatment X frequency interaction [F(27,81)=7.1; P<0.001]. For description of axes and symbols, please refer to figure 1.
Fig. 8
Fig. 8
Effects of the high-efficacy µ agonist methadone (a,b) and the low-efficacy nalbuphine (c,d) on ICSS in separate groups of opioid-naïve rats. ANOVA results were as follows: Methadone: Significant main effect of frequency [F(9,45)=33.8; P<0.001], significant main effect of dose [F(5,25)=18.5; P<0.001], and significant dose X frequency interaction [F(45,225)=8.2; P<0.001]; Nalbuphine: Significant main effect of frequency [F(9,45)=30.0; P<0.001], no significant main effect of dose [F(6,30)=2.2; P=0.074], and significant dose X frequency interaction [F(54,270)=2.2; P<0.001]. For description of axes and symbols, please refer to figure 1.

References

    1. Altarifi AA, Negus SS. Some determinants of morphine effects on intracranial self-stimulation in rats: Dose, pretreatment time, repeated treatment, and rate dependence. Behav Pharmacol. 2011;22:663–673. - PMC - PubMed
    1. Bardo MT, Gehrke BJ, Shortridge BE, Rauhut AS. Effects of beta-funaltrexamine and naloxonazine on single-trial morphine-conditioned place preference and locomotor activity. Pharmacol Biochem Behav. 2003;74:617–622. - PubMed
    1. Broekkamp CL, Van Den Bogaard JH, Heijnen HJ, Rops RH, Cools AR, Van Rossum JM. Separation of inhibiting and stimulating effects of morphine on self-stimulation behaviour by intracerebral microinjections. Eur J Pharmacol. 1976;36:443–446. - PubMed
    1. Carlezon WA, Jr, Wise RA. Morphine-induced potentiation of brain stimulation reward is enhanced by mk-801. Brain Res. 1993;620:339–342. - PubMed
    1. Cicero TJ, Dart RC, Inciardi JA, Woody GE, Schnoll S, Munoz A. The development of a comprehensive risk-management program for prescription opioid analgesics: Researched abuse, diversion and addiction-related surveillance (radars) Pain Med. 2007;8:157–170. - PubMed

Publication types