

Validation of food store environment secondary data source and the role of neighborhood deprivation in Appalachia, Kentucky
- PMID: 22914100
- PMCID: PMC3491041
- DOI: 10.1186/1471-2458-12-688
Validation of food store environment secondary data source and the role of neighborhood deprivation in Appalachia, Kentucky
Abstract
Background: Based on the need for better measurement of the retail food environment in rural settings and to examine how deprivation may be unique in rural settings, the aims of this study were: 1) to validate one commercially available data source with direct field observations of food retailers; and 2) to examine the association between modified neighborhood deprivation and the modified retail food environment score (mRFEI).
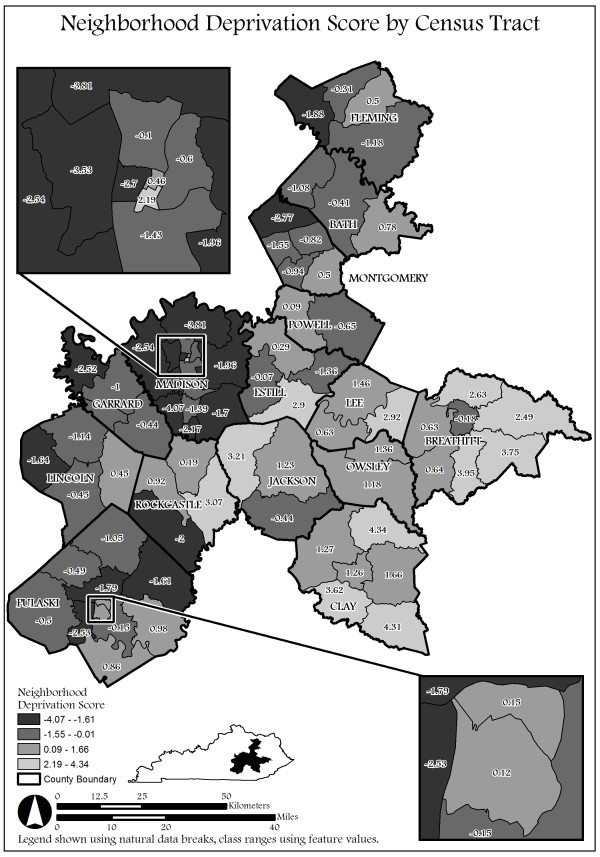
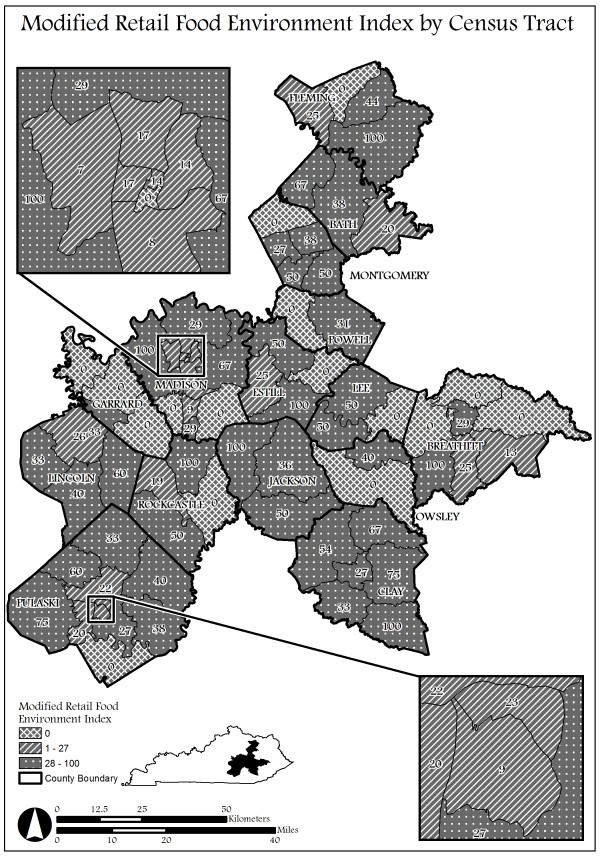
Methods: Secondary data were obtained from a commercial database, InfoUSA in 2011, on all retail food outlets for each census tract. In 2011, direct observation identifying all listed food retailers was conducted in 14 counties in Kentucky. Sensitivity and positive predictive values (PPV) were compared. Neighborhood deprivation index was derived from American Community Survey data. Multinomial regression was used to examine associations between neighborhood deprivation and the mRFEI score (indicator of retailers selling healthy foods such as low-fat foods and fruits and vegetables relative to retailers selling more energy dense foods).
Results: The sensitivity of the commercial database was high for traditional food retailers (grocery stores, supermarkets, convenience stores), with a range of 0.96-1.00, but lower for non-traditional food retailers; dollar stores (0.20) and Farmer's Markets (0.50). For traditional food outlets, the PPV for smaller non-chain grocery stores was 38%, and large chain supermarkets was 87%. Compared to those with no stores in their neighborhoods, those with a supercenter [OR 0.50 (95% CI 0.27. 0.97)] or convenience store [OR 0.67 (95% CI 0.51, 0.89)] in their neighborhood have lower odds of living in a low deprivation neighborhood relative to a high deprivation neighborhood.
Conclusion: The secondary commercial database used in this study was insufficient to characterize the rural retail food environment. Our findings suggest that neighborhoods with high neighborhood deprivation are associated with having certain store types that may promote less healthy food options.
Figures
References
-
- Jackson JE, Doescher MP, Jerant AF, Hart LG. A national study of obesity prevalence and trends by type of rural county. The Journal of rural health: official journal of the American Rural Health Association and the National Rural Health Care Association. 2005;21(2):140–148. Epub 2005/04/30. - PubMed
-
- Centers for Disease Control and Prevention. Behavioral Risk Factor Surveillance Survey County Prevalence Data. 2010 [2/12/2012] Available from: CDC/BRFSS/Obesity trends http://apps.nccd.cdc.gov/DDT_STRS2/CountyPrevalenceData.aspx?mode=OBS.
-
- U.S Department of Health and Human Services Centers for Disease Control and Prevention. Estimated county-level prevalence of diabetes and obesity - United States, 2007. MMWR Morb Mortal Wkly Rep. 2009;58(45):1259–1263. Epub 2009/11/27. - PubMed
Publication types
MeSH terms
LinkOut - more resources
Full Text Sources
