

Risk of stillbirth and infant death stratified by gestational age
- PMID: 22914394
- PMCID: PMC3719843
- DOI: 10.1097/AOG.0b013e31825bd286
Risk of stillbirth and infant death stratified by gestational age
Abstract
Objective: To estimate the multiple dimensions of risk faced by pregnant women and their health care providers when comparing the risks of stillbirth at term with the risk of infant death after birth.
Methods: This is a retrospective cohort study that included all nonanomalous, term deliveries in the state of California from 1997 to 2006 (N=3,820,826). The study compared infant mortality rates after delivery at each week of term pregnancy with the rates of a composite fetal-infant mortality that would occur after expectant management for 1 additional week.
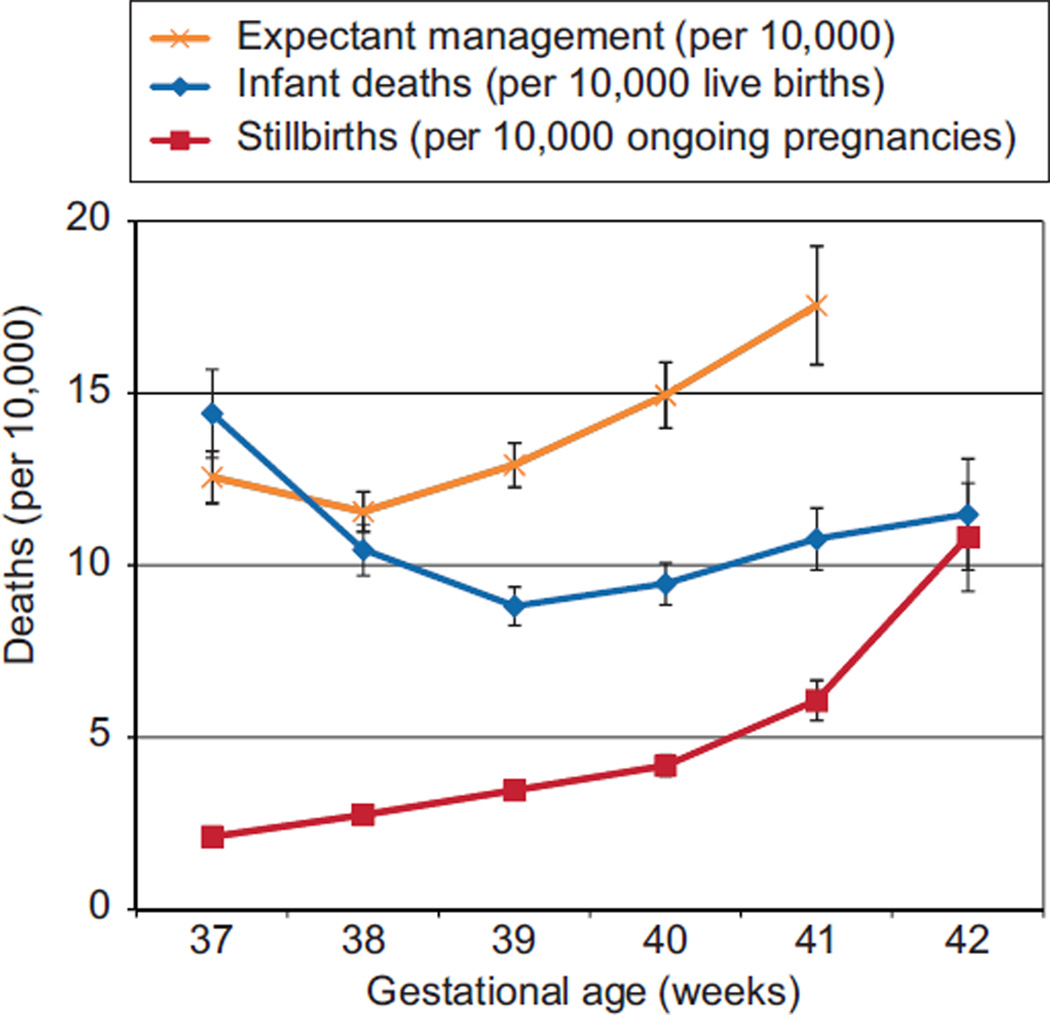
Results: The risk of stillbirth at term increases with gestational age from 2.1 per 10,000 ongoing pregnancies at 37 weeks of gestation up to 10.8 per 10,000 ongoing pregnancies at 42 weeks of gestation. At 38 weeks of gestation, the risk of expectant management carries a similar risk of death as delivery, but at each later gestational age, the mortality risk of expectant management is higher than the risk of delivery (39 weeks of gestation: 12.9 compared with 8.8 per 10,000; 40 weeks of gestation: 14.9 compared with 9.5 per 10,000; 41 weeks of gestation: 17.6 compared with 10.8 per 10,000).
Conclusion: Infant mortality rates at 39, 40, and 41 weeks of gestation are lower than the overall mortality risk of expectant management for 1 week.
Conflict of interest statement
The authors did not report any potential conflicts of interest.
Figures
Comment in
-
Risk of stillbirth and infant death stratified by gestational age.Obstet Gynecol. 2012 Nov;120(5):1211-2; author reply 1212. doi: 10.1097/aog.0b013e318272188f. Obstet Gynecol. 2012. PMID: 23090551 No abstract available.
References
-
- Reddy UM, Ko CW, Willinger M. Maternal age and the risk of stillbirth throughout pregnancy in the United States. Am J Obstet Gynecol. 2006;195:764–770. - PubMed
-
- Zhang X, Kramer MS. Variations in mortality and morbidity by gestational age among infants born at term. J Pediatr. 2009;154:358–362. 362.e1. - PubMed
-
- Bruckner TA, Cheng YW, Caughey AB. Increased neonatal mortality among normal-weight births beyond 41 weeks of gestation in California. Am J Obstet Gynecol. 2008;199:421, e1–e7. - PubMed
-
- Donovan EF, Besl J, Paulson J, Rose B, Iams J Ohio Perinatal Quality Collaborative. Infant death among Ohio resident infants born at 32 to 41 weeks of gestation. Am J Obstet Gynecol. 2010;203:58, e1–e5. - PubMed
Publication types
MeSH terms
Grants and funding
LinkOut - more resources
Full Text Sources
Medical
