

Glaucoma discrimination of segmented cirrus spectral domain optical coherence tomography (SD-OCT) macular scans
- PMID: 22914498
- PMCID: PMC3721629
- DOI: 10.1136/bjophthalmol-2011-301021
Glaucoma discrimination of segmented cirrus spectral domain optical coherence tomography (SD-OCT) macular scans
Abstract
Aims: To evaluate the glaucoma discriminating ability of macular retinal layers as measured by spectral domain optical coherence tomography (SD-OCT).
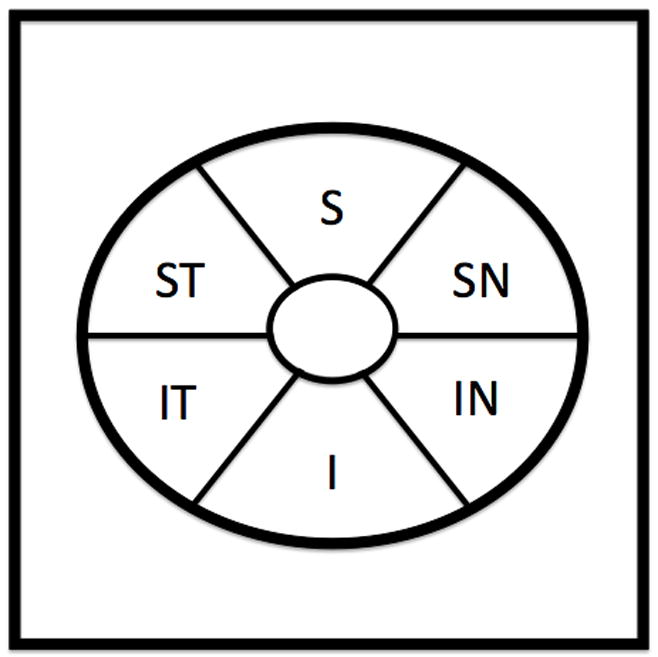
Methods: Healthy, glaucoma suspect and glaucomatous subjects had a comprehensive ocular examination, visual field testing and SD-OCT imaging (Cirrus HD-OCT; Carl Zeiss Meditec, Dublin, California, USA) in the macular and optic nerve head regions. OCT macular scans were segmented into macular nerve fibre layer (mNFL), ganglion cell layer with inner plexiform layer (GCIP), ganglion cell complex (GCC) (composed of mNFL and GCIP), outer retinal complex and total retina. Glaucoma discriminating ability was assessed using the area under the receiver operator characteristic curve (AUC) for all macular parameters and mean circumpapillary retinal nerve fibre layer (cpRNFL).
Results: Analysis was performed on 51 healthy, 49 glaucoma suspect and 63 glaucomatous eyes. The median visual field MD was -2.21 dB (IQR: -6.92 to -0.35) for the glaucoma group, -0.32 dB (IQR: -1.22 to 0.73) for the suspect group and -0.18 dB (IQR: -0.92 to 0.71) for the healthy group. Highest age adjusted AUCs were found for average GCC and GCIP (AUC=0.901 and 0.900, respectively) and their sectoral measurements: infero-temporal (0.922 and 0.913), inferior (0.904 and 0.912) and supero-temporal (0.910 and 0.897). These values were similar to the discriminating ability of the mean cpRNFL (AUC=0.913). Comparison of these AUCs did not yield any statistically significant difference (all p>0.05).
Conclusions: SD-OCT GCIP and GCC measurements showed similar glaucoma diagnostic ability and were comparable with that of cpRNFL.
Conflict of interest statement
Figures
References
-
- Curcio CA, Allen KA. Topography of ganglion cells in human retina. J Comp Neurol. 1990;300(1):5–25. - PubMed
-
- Zeimer R, Asrani S, Zou S, et al. Quantitative detection of glaucomatous damage at the posterior pole by retinal thickness mapping. A pilot study Ophthalmology. 1998;105(2):224–31. - PubMed
-
- Lederer DE, Schuman JS, Hertzmark E, et al. Analysis of macular volume in normal and glaucomatous eyes using optical coherence tomography. Am J Ophthalmol. 2003;135(6):838–43. - PubMed
-
- Giovannini A, Amato G, Mariotti C. The macular thickness and volume in glaucoma: an analysis in normal and glaucomatous eyes using OCT. Acta Ophthalmol Scand Suppl. 2002;236:34–6. - PubMed
-
- Greenfield DS, Bagga H, Knighton RW. Macular thickness changes in glaucomatous optic neuropathy detected using optical coherence tomography. Arch Ophthalmol. 2003;121(1):41–6. - PubMed
Publication types
MeSH terms
Grants and funding
LinkOut - more resources
Full Text Sources
Medical
Miscellaneous