. 2012 Aug 22;32(34):11559-73.
doi: 10.1523/JNEUROSCI.1042-12.2012.

Microglia proliferation is controlled by P2X7 receptors in a Pannexin-1-independent manner during early embryonic spinal cord invasion

Affiliations

Microglia proliferation is controlled by P2X7 receptors in a Pannexin-1-independent manner during early embryonic spinal cord invasion

Chiara Rigato et al. J Neurosci. .

Abstract

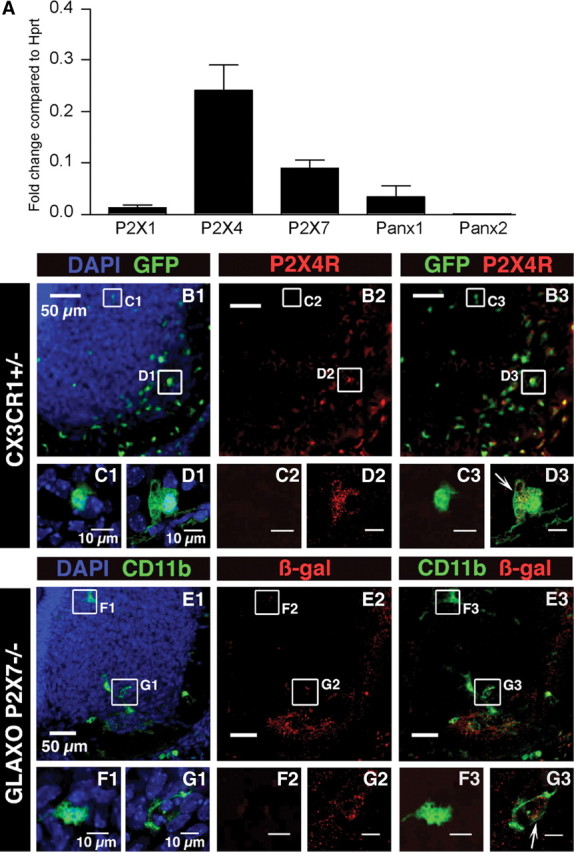
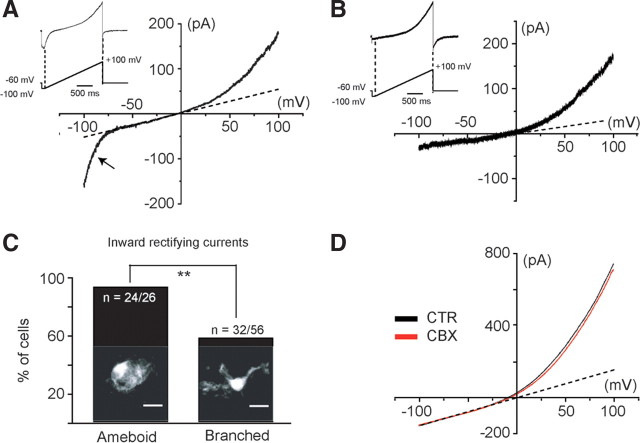
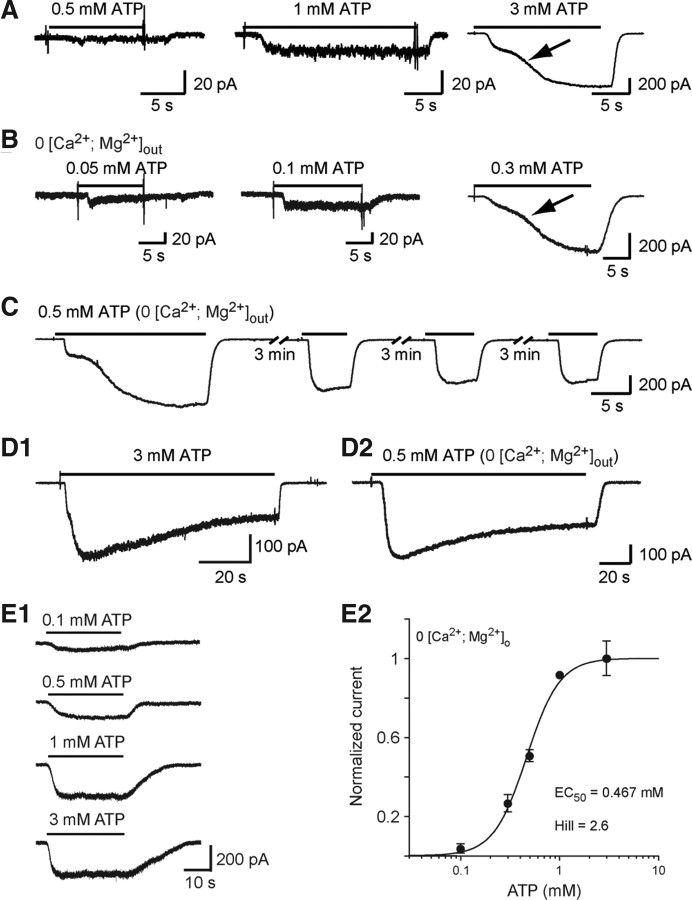
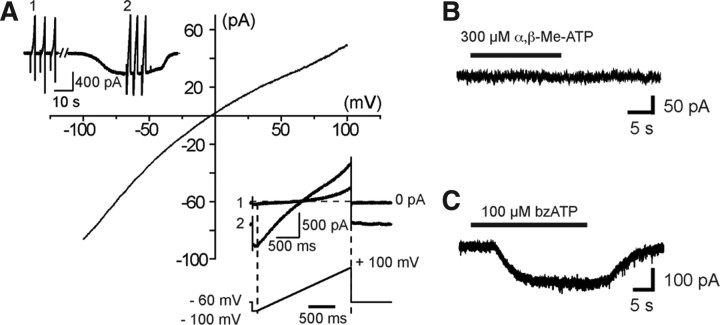
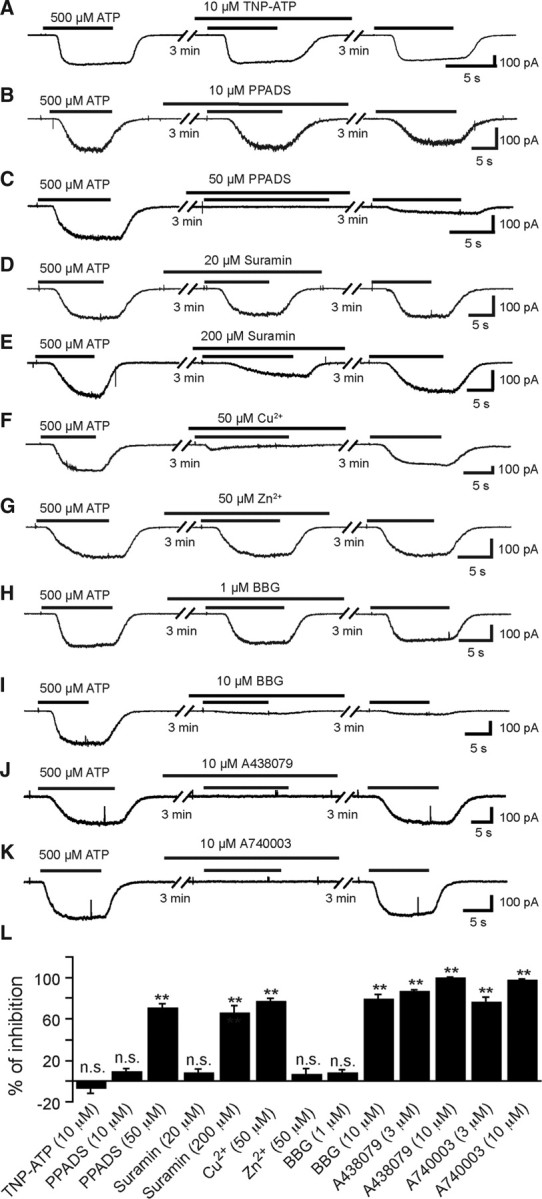
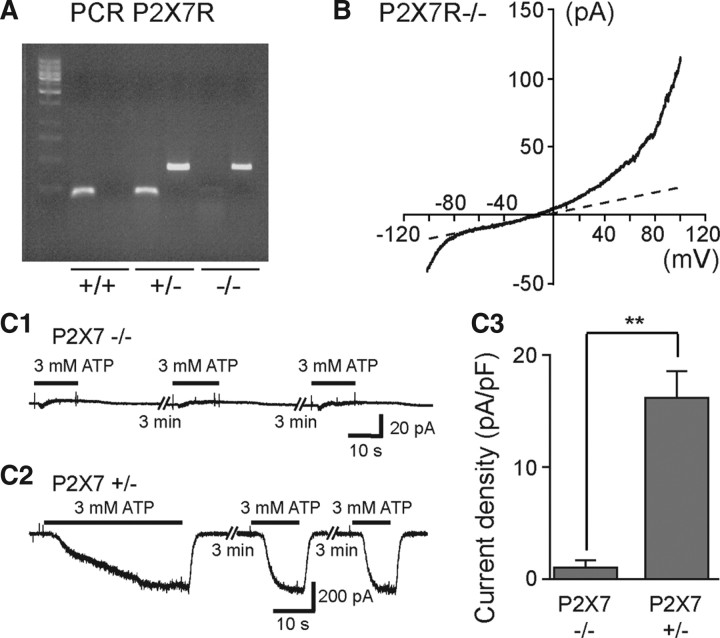
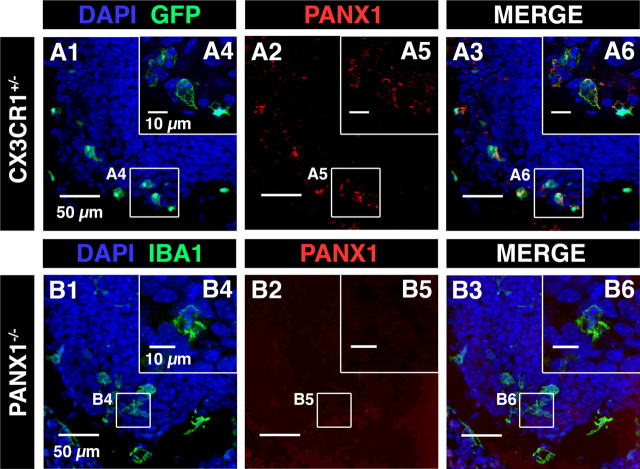
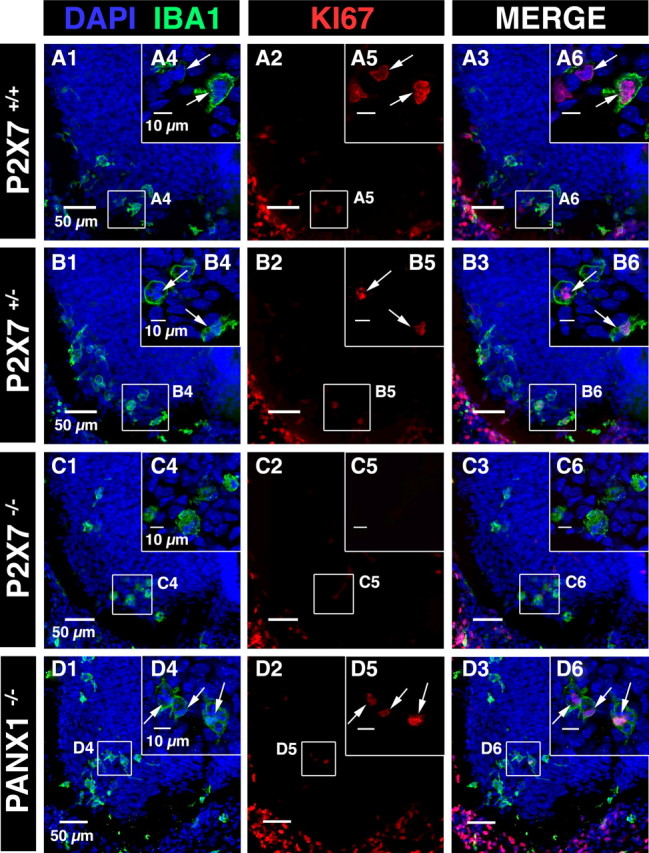
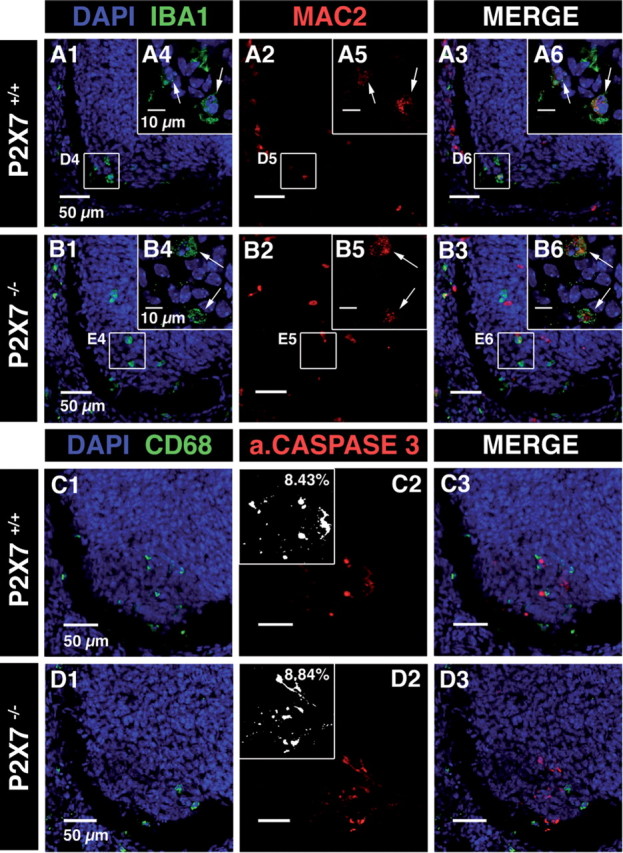
Microglia are known to invade the mammalian spinal cord (SC) at an early embryonic stage. While the mechanisms underlying this early colonization of the nervous system are still unknown, we recently found that it is associated, at least partially, with the ability of microglia to proliferate at the onset of motoneuron developmental cell death and of synaptogenesis in mouse embryo (E13.5). In vitro studies have shown that the proliferation and activation of adult microglia can be influenced by the purinergic ionotropic receptor P2X7 via a coupling with Pannexin-1. By performing patch-clamp recordings in situ using a whole-mouse embryonic SC preparation, we show here that embryonic microglia already express functional P2X7R. P2X7R activation evoked a biphasic current in embryonic microglia, which is supposed to reflect large plasma membrane pore opening. However, although embryonic microglia express pannexin-1, this biphasic current was still recorded in microglia of pannexin-1 knock-out embryos, indicating that it rather reflected P2X7R intrinsic pore dilatation. More important, we found that proliferation of embryonic SC microglia, but not their activation state, depends almost entirely on P2X7R by comparing wild-type and P2X7R-/- embryos. Absence of P2X7R led also to a decrease in microglia density. Pannexin-1-/- embryos did not exhibit any difference in microglial proliferation, showing that the control of embryonic microglial proliferation by P2X7R does not depend on pannexin-1 expression. These results reveal a developmental role of P2X7R by controlling embryonic SC microglia proliferation at a critical developmental state in the SC of mouse embryos.


Figures

Figure 1.
Figure 1.
P2X1R, P2X4R, P2X7R, Panx1, and Panx2 expression in microglia. A, P2X1R, P2X4R, P2X7R, Panx1, and Panx2 expressions were analyzed on FACS-sorted SC microglia using qPCR. For each gene, the expression level corresponds to the x-fold change relative to the housekeeping gene Hprt. Note that P2X4R and P2X7R are the main P2XR transcripts expressed. The P2X1R transcript expression level is significantly (p < 0.01) lower than those of P2X4R and P2X7R. Note that low levels of Panx2 mRNAs were detected when compared with Panx1 mRNAs (≈13-fold significantly lower; p < 0.01). Error bars indicate SEM. B–D, P2X4R immunostaining in the ventral region of the SC of E13.5 CX3CR1eGFP mouse embryos. B1, Representative pictures of the SC ventral region. Note the accumulation of microglia (green) in the ventrolateral part of the SC. B2, P2X4R immunostaining. B3, Superimposed images shown in B1 and B2. C1, Enlarged image showing an example of eGFP microglia localized in the dorsomedial region of the ventral SC. C2, Note the lack of P2X4R immunostaining in the area shown in C1. C3, Superimposed images (C1 and C2) showing lack of P2X4R immunostaining within eGFP-positive microglia localized in the dorsomedial region. D1, Enlarged image showing an example of eGFP microglia localized in the ventrolateral region of the ventral SC. D2, P2X4R immunostaining in the area shown in D1 (red). D3, Superimposed images (D1 and D2) showing P2X4R immunostaining within eGFP-positive microglia localized in the ventrolateral region (arrow). Note that the staining is mainly located within the cytoplasm (single confocal section). E–G, β-Galactosidase immunostaining in the ventral region of the SC of E13.5 GlaxoSmithKline P2X7R−/− mouse embryos where the LacZ reporter gene has been inserted into the P2X7R gene. E1, Representative pictures of the ventral SC in E13.5 GlaxoSmithKline P2X7R−/− mouse embryos. Microglia were stained using CD11b antibody. E2, β-Galactosidase staining in the ventral SC. E3, Superimposed images shown in E1 and E2. F1, Enlarged image showing an example of microglia localized in the dorsomedial region of the ventral SC. F2, β-Galactosidase immunostaining in the area of the microglia shown in F1. Note the lack of galactosidase immunostaining. F3, Superimposed images shown in F1 and F2. G1, Enlarged image showing an example of microglia localized in the ventrolateral region of the ventral SC. G2, Galactosidase immunostaining in the area shown in G1. G3, Superimposed images (G1 and G2) showing galactosidase immunostaining within CD11b-positive microglia localized in the ventrolateral region (arrow; single confocal section), which indicates P2X7R gene expression in microglia. B1, C1, D1, E1, F1, G1, Cell nuclei are visualized with DAPI staining.
Figure 2.
Figure 2.
Voltage-activated current profile in microglia of the developing SC. Voltage-activated current was analyzed using voltage ramps ranging from −100 to +100 mV over 2 s. Two different voltage-activated current patterns could be distinguished: an IrC, observed at membrane potentials lower than ≈−70 mV (A), and an OrC (B). C, The absence or the presence of IrC was significantly correlated (p < 0.05) to the morphology of the recorded microglia (Fisher's exact test, p < 0.05). Confocal images (Z-stack) showing amoeboid microglia (left) and branched microglia (right) in the ventral SC area of CXCR1 EGFP mice. D, The gap junction/hemichannel blocker CBX (100 μm) had no effect on the OrC (p > 0.1). This current was 8.4 ± 4.8% inhibited in the presence of 100 μm CBX (N = 8). CTR, Control.
Figure 3.
Figure 3.
ATP evokes inward currents in embryonic microglia. A, Example of responses evoked by 0.5, 1, and 3 mm ATP in the presence of 1.3 mm [Ca2+]o and 3 mm [Mg2+]o. Note the biphasic activation phase (arrow) of the response evoked by 3 mm ATP. B, Currents evoked by 0.05, 0.1, and 0.3 mm ATP in [Ca2+ + Mg2+]o = 0. C, Currents evoked by repetitive applications of 0.5 mm ATP in [Ca2+ + Mg2+]o = 0. D, Current evoked by long application of 3 mm ATP in the presence (D1) and of 0.5 mm ATP in the absence (D2) of [Ca2+ + Mg2+]o. This response slowly desensitized (half-amplitude decay time = 26.9 s in the presence of [Ca2+ + Mg2+]o and 41.9 s in free [Ca2+ + Mg2+]o solution). Large inward currents evoked by 140 s application of ATP after eliciting a biphasic response slowly decreased with time in both normal [Ca2+, Mg2+]out (3 mm ATP) and free [Ca2+, Mg2+]out (0.5 mm ATP) solutions and reached a plateau representing 50.5 ± 3.1% (N = 5) of the peak current in normal [Ca2+, Mg2+]out solution and 64.7 ± 5.2% (N = 8) in free [Ca2+, Mg2+]out. The half-desensitization time was 25.9 ± 3.3 s (N = 5) in normal [Ca2+, Mg2+]out and 36.9 ± 6.5 s (N = 8) in free [Ca2+, Mg2+]out. E1, Example of currents evoked by increasing ATP concentrations after having obtained a biphasic response ([Ca2+ + Mg2+]o = 0). E2, Dose–response curve of ATP-evoked currents as shown in E1 (EC50 = 467 μm; Hill coefficient = 2.6). Each point represents the average of 5–10 measurements. The amplitude of the ATP-evoked responses has been normalized to the current amplitude of the responses evoked by 1 mm ATP (see Materials and Methods). (Vh =−60 mV). Error bars indicate SEM.
Figure 4.
Figure 4.
Whole-cell currents evoked by ATP and P2XR agonists in embryonic microglia in situ. A, A voltage ramp protocol (−100 mV +100 mV; 2 s) was used to determine the reversal potential of ATP-evoked currents (inset lower right). A set of three voltage ramps from −100 to 100 mV (interval) was applied before and during the response to 3 mm ATP (inset upper left) and the resulting currents were averaged. The averaged currents evoked before ATP application were subtracted from the averaged currents evoked during ATP application to obtain the current–voltage relationship of the current evoked by ATP. In this example, 3 mm ATP evoked inward currents with a reversal potential of −3.2 mV. B, Application of α,β-Me-ATP (300 μm), a P2X1R and P2X3R agonist, failed to evoke a response in embryonic SC microglia (Vh = −60 mV). C, In contrast, bzATP (100 μm), a compound acting as an agonist on P2X7Rs and also effective on P2X1Rs and P2X2Rs, induced inward currents (Vh = −60 mV). bzATP (100 μm)evoked a current of 9 ± 2 pA/pF (N = 6).
Figure 5.
Figure 5.
Effects of TNP-ATP, PPADS, suramin, copper, zinc, BBG, A438079, and A740003 on ATP-evoked currents in SC microglia. All compounds were applied before and during ATP application (500 μm; free [Ca2+, Mg2+]o; Vh = −60 mV). A, ATP-evoked current was poorly sensitive to TNP-ATP (10 μm), a selective antagonist of P2X1R, P2X3R, and P2X4R (p > 0.05). B, PPADS (10 μm) did not prevent ATP-evoked currents. C, PPADS (50 μm) fully blocked ATP-evoked currents. Note that ATP-evoked responses were poorly reversible 3 min after the end of the PPADS application. D, Suramin (20 μm) did not inhibit ATP-evoked responses as expected for P2X7Rs. E, Suramin (200 μm) partially blocked ATP-evoked currents. F, Copper (50 μm), known to block P2X7R activity, reversibly inhibited ATP-evoked currents. G, Zn2+ (50 μm) was poorly effective on ATP-evoked currents. H, BBG (1 μm) at this concentration was poorly effective on ATP-evoked currents. I, BBG (10 μm), known at this concentration to inhibit both P2X7R and P2X4R, irreversibly inhibited ATP-evoked currents. J, A438079 (10 μm) known at this concentration to inhibit selectively murine P2X7R fully inhibited ATP-evoked currents. K, A740003 (10 μm) also known to inhibit selectively murine P2X7R fully blocked ATP-evoked currents. L, Quantification of the inhibitory effects of the antagonists on ATP-evoked responses. Inhibitions of ATP responses were as follows: −6.8 ± 5.5% (N = 6) for 10 μm TNP-ATP, 8.7 ± 3% (N = 5) for 10 μm PPADS, 70.3 ± 4.4% (N = 6) for 50 μm PPADS, 7.2 ± 3.9% (N = 6) for 20 μm suramin, 65.7 ± 7.4% (N = 5) for 200 μm suramin, 76.8 ± 3.4% (N = 13) for 50 μm Cu2+, 5.9 ± 5.6% (N = 10) for 50 μm Zn2+, 7.2 ± 3.4% (N = 10) for 1 μm BBG, 79.3 ± 4.5% (N = 5) for 10 μm BBG, 86.8 ± 1.5% (N = 5) for 3 μm A438079, 76 ± 5% (N = 5) for 3 μm A740003, 99.8 ± 0.8% (N = 5) for 10 μm A438079, and 97.4 ± 1.6% (N = 5) for 10 μm A740003. (Statistical significance: **p < 0.01, * p < 0.05). Error bars indicate SEM.
Figure 6.
Figure 6.
ATP-evoked biphasic currents were not observed in SC microglia of P2X7R−/− mouse embryos. A, PCR results for wild-type (+/+) mice, heterozygote mice (+/−), and P2X7R KO mice (−/−). B, Voltage-current relationship of microglia recorded in the SC of E13.5 P2X7R−/− mouse embryos. A voltage ramp protocol (−100 mV +100 mV; 2 s) was used to investigate voltage-activated currents. C1, Application of 3 mm ATP on microglia recorded in the SC of P2X7R −/− mouse E13.5 embryo failed to evoked large biphasic inward currents. C2, Examples of currents evoked by 3 mm ATP on microglia of a P2X7R +/− mouse E13.5 embryo. C3, Histogram showing differences in current density of 3 mm ATP-evoked responses in SC microglia of P2X7R −/− (0.93 ± 0.43 pA/pF; N = 5) and P2X7R +/− (16.5 ± 2.12 pA/pF; N = 7) mouse embryos. (Vh = −60 mV). Input capacitance of recorded microglia in P2X7R−/− embryos (11.9 ± 1.4 pF; N = 5) and in P2X7R +/− embryos (10.3 ± 1 pF; N = 7) were not significantly different (p > 0.1). Error bars indicate SEM.
Figure 7.
Figure 7.
Panx1 immunostaining was not observed in the SC of Panx1−/− mouse embryos. A, Confocal image of immunostaining against Panx1 (red; A2, A3, A5, and A6) in the ventral SC of CX3CR1eGFP mouse embryo. A3, B3, Superposition of IBA1 and Panx1 immunostainings. A4, A6, Single confocal sections showing microglia located in the ventrolateral area of the SC. A2, A5, Panx1 immunostaining in the ventral SC of CX3CR1eGFP mouse embryo. A3, Superimposed images (A1 and A2) showing Panx1 staining in microglia. A6, Superimposed images showing Panx1 staining in microglia localized in the ventrolateral region. B, Confocal image of immunostaining against Panx1 (red; B2, B3, B5. and B6) in the ventral SC of Panx1−/− mouse embryo. B1, B4, Microglia were stained using IBA1 antibody. B1, B2, B3, Panx1 immunostaining in the SC of E13.5 Panx1−/− mouse embryos. B1, B3, B4, B6, Microglia were revealed using IBA1 antibody (green). Note that Panx1 immunostaining was no longer observed in the SC of E13.5 Panx1−/− mouse, indicating that this antibody specifically recognizes Panx1. A1, A3, A4, A6, B1, B3, B4, B6, Cell nuclei are visualized with DAPI staining.
Figure 8.
Figure 8.
ATP-evoked biphasic currents did not result from Panx1 activation. A, PCR results for wild-type (+/+) mice, heterozygote mice (+/−), and Panx1 KO mice (−/−). B, Voltage-current relationship of currents recorded in microglia obtained from the SC of E13.5 Panx1−/− mouse embryos. A voltage ramp protocol (−100 mV +100 mV; 2 s) was used to investigate voltage-activated currents. C1, C2, Effect of high concentrations of the hemichannel blockers DIDS and CBX on ATP-evoked currents (3 mm ATP; Vh = −60 mV) in CXCR1eGFP mice. C3, 100 μm DIDS significantly (p < 0.01) inhibits 28.3 ± 2.9% (N = 11) of ATP responses while 100 μm CBX had no significant effect (p > 0.1) (9.9 ± 6.6% increase; N = 7). The percentage change in response amplitude observed during the application of the blockers was compensated according to the averaged decrease (rundown: 6.8%) in the corresponding responses observed on different cells in the absence of the blockers (Normal [Ca2+]o and [Mg2+]o ACSF: see Materials and Methods and Results). Error bars indicate SEM. D, Currents evoked by 3 mm ATP on microglia recorded from the SC of E13.5 Panx1 −/− mouse embryos. Note that ATP application evoked a biphasic current as observed in CX3CR1eGFP and in P2X7+/− mouse embryos (Figs. 3, 6).
Figure 9.
Figure 9.
Microglia proliferation was dramatically reduced in the SC of P2X7R−/− mouse embryos but was unchanged in the SC of Panx1−/− mouse embryos. A1, B1, C1, D1, DAPI staining (blue) and microglia accumulation (IBA1 immunostaining, green) in the ventral region of P2X7R+/+, P2X7R+/−, P2X7R−/−, and Panx1−/− E13.5 SCs. A2, B2, C2, D2, Nuclear staining of KI67-expressing cells (red). A3, B3, C3, D3, Superposition of IBA1 and KI67 immunostainings. A4, B4, C4, Examples of microglia localized in the ventrolateral region of the SCs. A5, B5, C5, Example of KI67 staining in the ventrolateral region of the SC. A6, B6, White arrows indicate KI67 staining (single confocal section). Contrary to P2X7 +/+ SC (A6) and P2X7+/− SC (B6), LMC microglia are not stained for KI67 in P2X7R−/− SC (C6, single confocal section). D1, Example of microglia localized in the ventral SC of E13.5 Panx1−/− mouse embryos. D2, Immunostaining for KI67 in the ventral SC of E13.5 Panx1−/− mouse embryos. D3, superimposed images shown in D1 and D2. D4, Example of microglia localized in the ventrolateral region of the SC of E13.5 Panx1−/− mouse embryos. D5, KI67 staining in the ventrolateral region of the SC of E13.5 Panx1−/− mouse embryos. Note that KI67 immunostaining (arrows; D5) colocalized with IBA1 immunostaining (arrows; D6), indicating that microglia proliferated in the ventrolateral region of the SC of E13.5 Panx1−/− mouse embryos. D4, D5, D6, Single confocal section.
Figure 10.
Figure 10.
Microglia activation and MN developmental cell death were not altered in the SC of E13.5 P2X7R−/− mouse embryos. A, B, Confocal image of immunostainings against IBA1 (A1 and B1) and Mac-2 (red; A2 and B2) in the SC of wild-type (A) and P2X7R−/− (B) mouse embryos. A1, B1, DAPI staining (blue) and microglia staining (IBA1 immunostaining, green) in the ventrolateral region of the SC. A3, B3, Superposition of IBA1 and Mac-2 immunostainings. Note that Mac-2 immunostaining colocalized with IBA1 immunostaining, indicating that microglia were activated in the LMC of the SC of E13.5 P2X7R+/+ mouse embryos (arrows; A4A6) and of E13.5 P2X7R−/− mouse embryos (arrows; B4B6). A4, B4, Single confocal section showing microglia located in the ventrolateral region of the SC. C, D, Confocal image of immunostainings against CD68 (C1 and D1) and activated caspase-3 (red; C2 and D2) in the ventral SC of wild-type (C) and of P2X7R−/− (D) mouse embryos. C1, D1, DAPI staining (blue) and microglia staining (CD68 immunostaining, green) in the ventrolateral region of the SC. C3, D3, Superposition of CD68 and activated caspase-3 immunostainings. Insets in C2 and D2 are measurements of the percentage of fluorescence in the ventrolateral region of the SC (see Materials and Methods).

Similar articles

Cited by

References

    1. Acuña-Castillo C, Coddou C, Bull P, Brito J, Huidobro-Toro JP. Differential role of extracellular histidines in copper, zinc, magnesium and proton modulation of the P2X7 purinergic receptor. J Neurochem. 2007;101:17–26. - PubMed
    1. Avignone E, Ulmann L, Levavasseur F, Rassendren F, Audinat E. Status epilepticus induces a particular microglial activation state characterized by enhanced purinergic signaling. J Neurosci. 2008;28:9133–9144. - PMC - PubMed
    1. Bernier LP, Ase AR, Boué-Grabot E, Séguéla P. P2X4 receptor channels form large noncytolytic pores in resting and activated microglia. Glia. 2012;60:728–737. - PubMed
    1. Bianco F, Ceruti S, Colombo A, Fumagalli M, Ferrari D, Pizzirani C, Matteoli M, Di Virgilio F, Abbracchio MP, Verderio C. A role for P2X7 in microglial proliferation. J Neurochem. 2006;99:745–758. - PubMed
    1. Billiards SS, Haynes RL, Folkerth RD, Trachtenberg FL, Liu LG, Volpe JJ, Kinney HC. Development of microglia in the cerebral white matter of the human fetus and infant. J Comp Neurol. 2006;497:199–208. - PubMed

Publication types

MeSH terms

Substances