. 2012;8(8):e1002582.
doi: 10.1371/journal.pcbi.1002582. Epub 2012 Aug 16.

Activity dependent degeneration explains hub vulnerability in Alzheimer's disease

Affiliations

Activity dependent degeneration explains hub vulnerability in Alzheimer's disease

Willem de Haan et al. PLoS Comput Biol. 2012.

Abstract

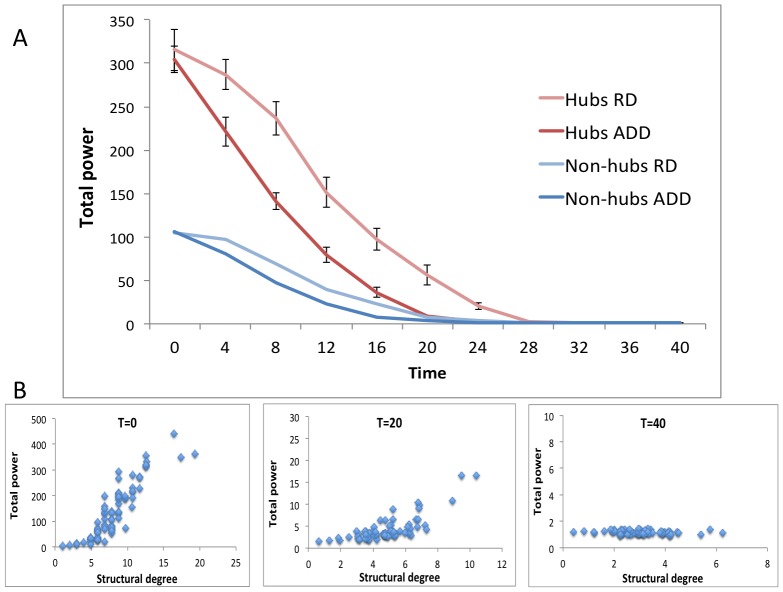
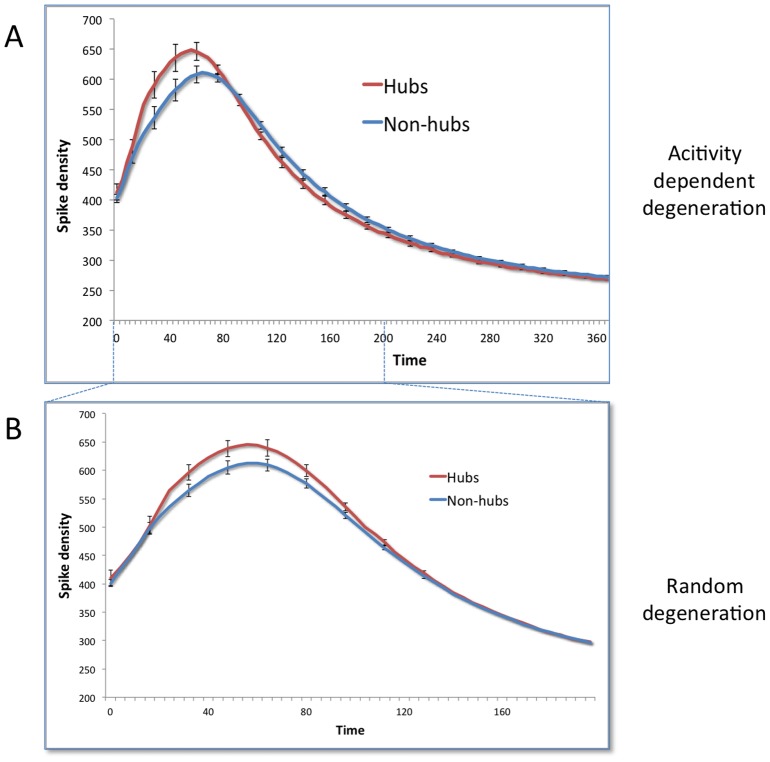
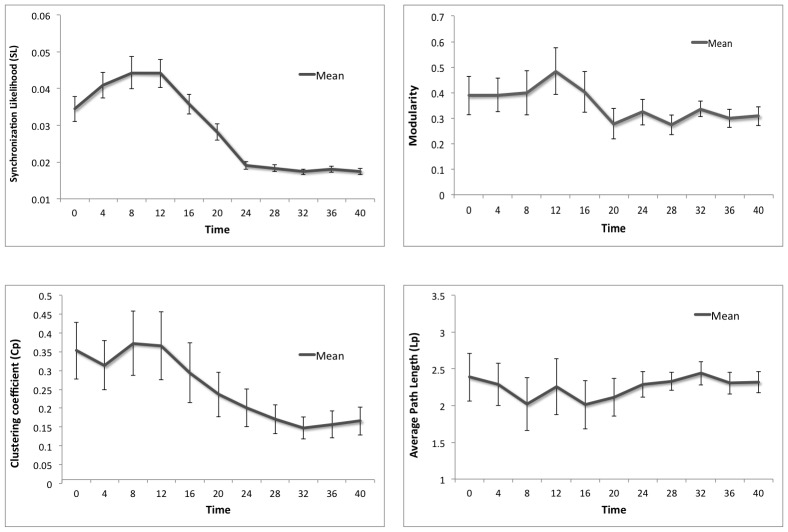
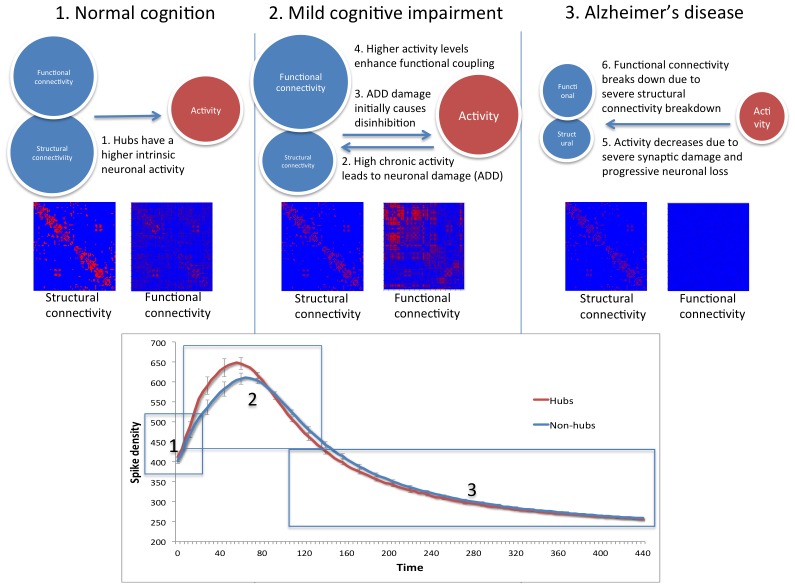
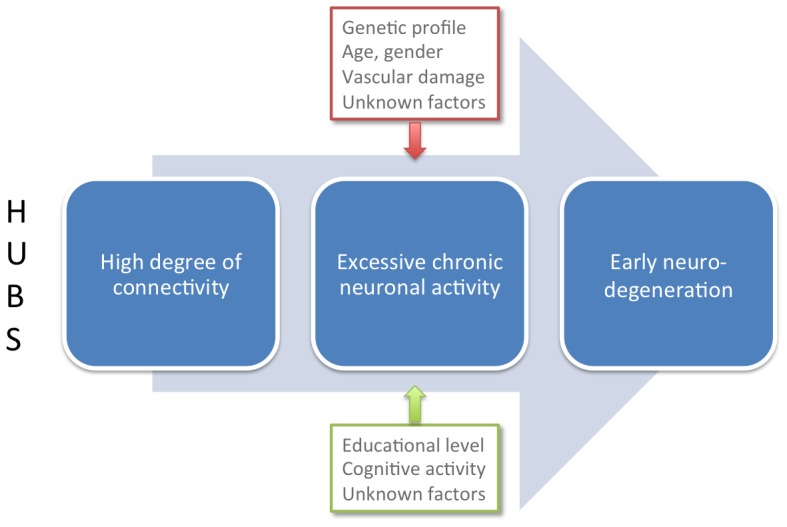
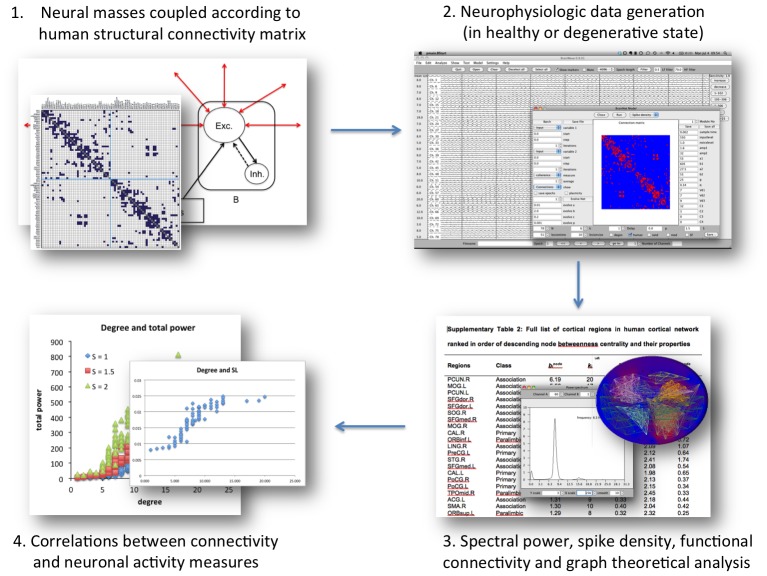
Brain connectivity studies have revealed that highly connected 'hub' regions are particularly vulnerable to Alzheimer pathology: they show marked amyloid-β deposition at an early stage. Recently, excessive local neuronal activity has been shown to increase amyloid deposition. In this study we use a computational model to test the hypothesis that hub regions possess the highest level of activity and that hub vulnerability in Alzheimer's disease is due to this feature. Cortical brain regions were modeled as neural masses, each describing the average activity (spike density and spectral power) of a large number of interconnected excitatory and inhibitory neurons. The large-scale network consisted of 78 neural masses, connected according to a human DTI-based cortical topology. Spike density and spectral power were positively correlated with structural and functional node degrees, confirming the high activity of hub regions, also offering a possible explanation for high resting state Default Mode Network activity. 'Activity dependent degeneration' (ADD) was simulated by lowering synaptic strength as a function of the spike density of the main excitatory neurons, and compared to random degeneration. Resulting structural and functional network changes were assessed with graph theoretical analysis. Effects of ADD included oscillatory slowing, loss of spectral power and long-range synchronization, hub vulnerability, and disrupted functional network topology. Observed transient increases in spike density and functional connectivity match reports in Mild Cognitive Impairment (MCI) patients, and may not be compensatory but pathological. In conclusion, the assumption of excessive neuronal activity leading to degeneration provides a possible explanation for hub vulnerability in Alzheimer's disease, supported by the observed relation between connectivity and activity and the reproduction of several neurophysiologic hallmarks. The insight that neuronal activity might play a causal role in Alzheimer's disease can have implications for early detection and interventional strategies.


Conflict of interest statement

The authors have declared that no competing interests exist.

Figures

Figure 1
Figure 1. Relation between structural degree and neuronal activity.
A: Six bins with ascending mean structural degrees are plotted against their average spike density and total power values. Nodes in the ‘very high’ degree bin were defined as hubs. Coupling strength (S) between neural masses was set to 1.5. Error bars indicate standard deviation within each bin. B: Similar plots as in the left panel, but for every region individually, and for three different coupling strengths S (see Text S1, section 3).
Figure 2
Figure 2. Effect of ADD on structural degree.
A: All cortical regions binned according to initial structural degree from low to high values, and their average normalized node strengths at different stages of activity dependent degeneration (ADD). T = time. Error bars indicate standard error of the mean. B: All cortical regions binned according to initial structural degree from low to high values, and their average normalized node strengths at different stages of random degeneration (RD). T = time. Error bars indicate standard error of the mean.
Figure 3
Figure 3. Effect of ADD on total power.
A: Average total power of hub and non-hub regions plotted over time, for both the ADD and RD procedure. Error bars indicate standard error of the mean. B: Correlation between structural degree and total power for all regions at different time points during ADD.
Figure 4
Figure 4. Effect of ADD on spike density.
A: Average level of spike density during ADD is plotted for hubs and non-hubs. Error bars indicate standard deviations. B: Average level of spike density during RD is plotted for hubs and non-hubs. Error bars indicate standard deviations.
Figure 5
Figure 5. Effect of ADD on functional connectivity and network topology.
Mean levels of synchronization likelihood, modularity, clustering coefficient and path length during ADD are plotted for hubs and non-hubs. Error bars indicate standard deviations.
Figure 6
Figure 6. The relation between connectivity and activity at different stages of ADD.
The proposed relation between connectivity and activity is summarized for three different stages of ADD. Structural hubs have a higher baseline intrinsic activity, making them most susceptible to ADD. The second phase might represent the ‘Mild Cognitive Impairment’ (MCI) stage; structural connectivity declines steadily, but functional connectivity, power and spike density initially increase, leading to a pathologic spiral of increasing activity and metabolic burden in progressively weaker neurons. In the third “AD” phase, the damaged neurons and decreasing structural connectivity can no longer support the high demands, and the network collapses.
Figure 7
Figure 7. The role of excessive neuronal activity in Alzheimer's disease.
Excessive neuronal activity might be a common pathway through which many of the known risk factors enlarge the chance to develop Alzheimer pathology. Hub regions are most likely to display activity-dependent pathology, since they have the highest intrinsic neuronal activity (which is further amplified in the initial phase of ADD).
Figure 8
Figure 8. Outline of the consecutive steps in the experimental procedure.
Multi-step procedure from the simulation of realistic human neurophysiological activity to analyzing and correlating connectivity and activity results.

References

    1. Hagmann P, Cammoun L, Gigandet X, Meuli R, Honey CJ, et al. (2008) Mapping the structural core of human cerebral cortex. PLoS Biol 6: e159. - PMC - PubMed
    1. Zamora-López G, Zhou C, Kurths J (2010) Cortical hubs form a module for multisensory integration on top of the hierarchy of cortical networks. Front Neuroinformatics 4: 1. - PMC - PubMed
    1. van den Heuvel MP, Sporns O (2011) Rich-Club Organization of the Human Connectome. J Neurosci 31: 15775. - PMC - PubMed
    1. Buckner RL, Snyder AZ, Shannon BJ, LaRossa G, Sachs R, et al. (2005) Molecular, structural, and functional characterization of Alzheimer's disease: evidence for a relationship between default activity, amyloid, and memory. J Neurosci 25: 7709–7717. - PMC - PubMed
    1. Raichle ME, Snyder AZ (2007) A default mode of brain function: a brief history of an evolving idea. Neuroimage 37: 1083–90 discussion 1097-9. - PubMed