Combining the finite element method with structural connectome-based analysis for modeling neurotrauma: connectome neurotrauma mechanics
- PMID: 22915997
- PMCID: PMC3420926
- DOI: 10.1371/journal.pcbi.1002619
Combining the finite element method with structural connectome-based analysis for modeling neurotrauma: connectome neurotrauma mechanics
Erratum in
- PLoS Comput Biol. 2012;8(9): doi/10.1371/annotation/fd39b102-fb25-4ff2-9907-07af01ea6801
Abstract
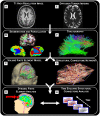
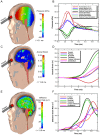
This article presents the integration of brain injury biomechanics and graph theoretical analysis of neuronal connections, or connectomics, to form a neurocomputational model that captures spatiotemporal characteristics of trauma. We relate localized mechanical brain damage predicted from biofidelic finite element simulations of the human head subjected to impact with degradation in the structural connectome for a single individual. The finite element model incorporates various length scales into the full head simulations by including anisotropic constitutive laws informed by diffusion tensor imaging. Coupling between the finite element analysis and network-based tools is established through experimentally-based cellular injury thresholds for white matter regions. Once edges are degraded, graph theoretical measures are computed on the "damaged" network. For a frontal impact, the simulations predict that the temporal and occipital regions undergo the most axonal strain and strain rate at short times (less than 24 hrs), which leads to cellular death initiation, which results in damage that shows dependence on angle of impact and underlying microstructure of brain tissue. The monotonic cellular death relationships predict a spatiotemporal change of structural damage. Interestingly, at 96 hrs post-impact, computations predict no network nodes were completely disconnected from the network, despite significant damage to network edges. At early times (t < 24 hrs) network measures of global and local efficiency were degraded little; however, as time increased to 96 hrs the network properties were significantly reduced. In the future, this computational framework could help inform functional networks from physics-based structural brain biomechanics to obtain not only a biomechanics-based understanding of injury, but also neurophysiological insight.
Conflict of interest statement
The authors have declared that no competing interests exist.
Figures


 , is reached. For this study, DTI tracts that traverse a damaged voxel are removed, thus degrading the connection strength of the network edge.


 is shown in (a). The evolution of connection strength matrices for 0 (a), 24 (b), 48 (c), 72 (d), and 96 hours (e) are shown, as well as (f) the connection strength matrix for the case when a
  strain threshold is used.

References
-
- Horgan TJ, Gilchrist MD (2003) The creation of three-dimensional nite element models for simulating head impact biomechanics. Int J Crashworthiness 8: 353–366.
-
- Takhounts EG, Eppinger RH, Campbell JQ, Tannous RE, Power ED, et al. (2003) On the development of the simon finite element head model. Stapp Car Crash J 47: 107–33. - PubMed
-
- Sayed TE, Mota A, Fraternali F, Ortiz M (2008) Biomechanics of traumatic brain injury. Comput Methods Appl Mech Eng 197: 4692–4701.
-
- Ho J, Kleiven S (2009) Can sulci protect the brain from traumatic injury? J Biomech 42: 2074–2080. - PubMed
-
- Moss WC, King MJ, Blackman EG (2009) Skull exure from blast waves: A mechanism for brain injury with implications for helmet design. Phys Rev Lett 103: 108702. - PubMed
Publication types
MeSH terms
LinkOut - more resources
Full Text Sources

