

Changes in community structure of resting state functional connectivity in unipolar depression
- PMID: 22916105
- PMCID: PMC3423402
- DOI: 10.1371/journal.pone.0041282
Changes in community structure of resting state functional connectivity in unipolar depression
Abstract
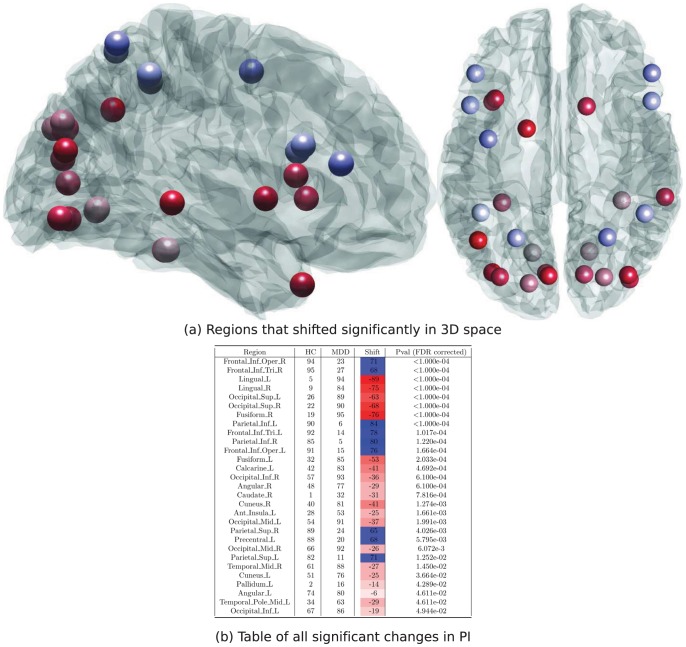
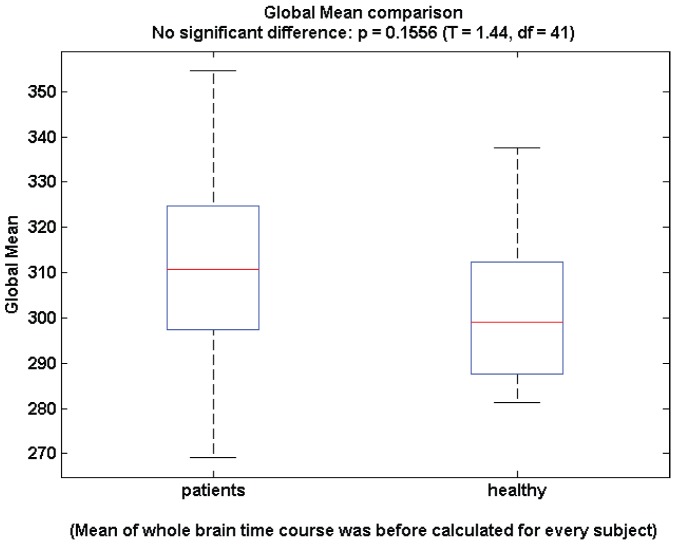
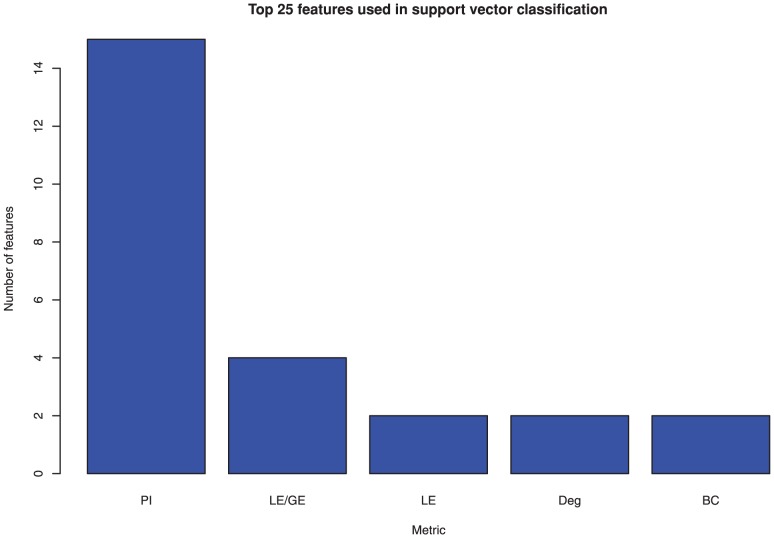
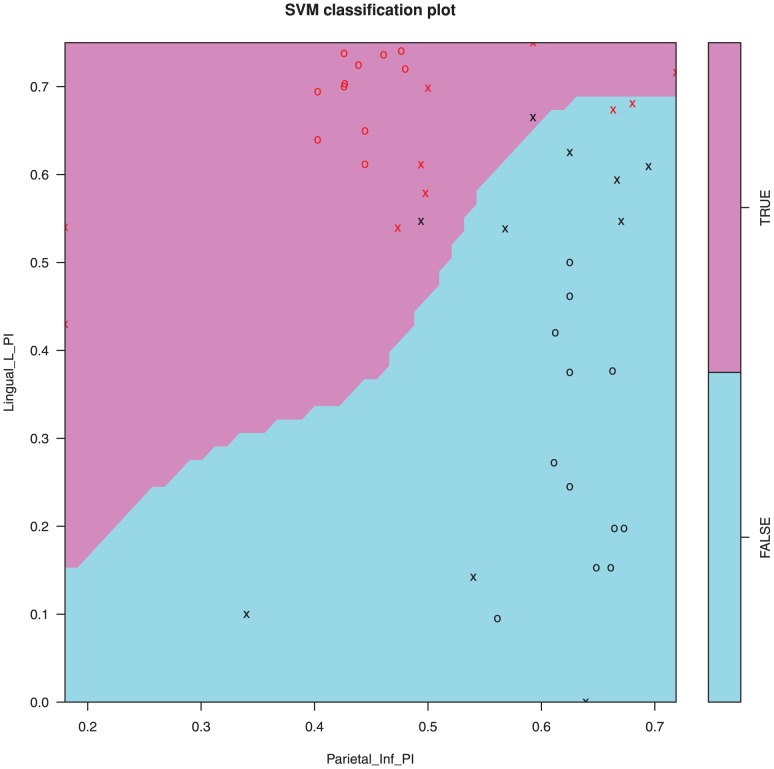
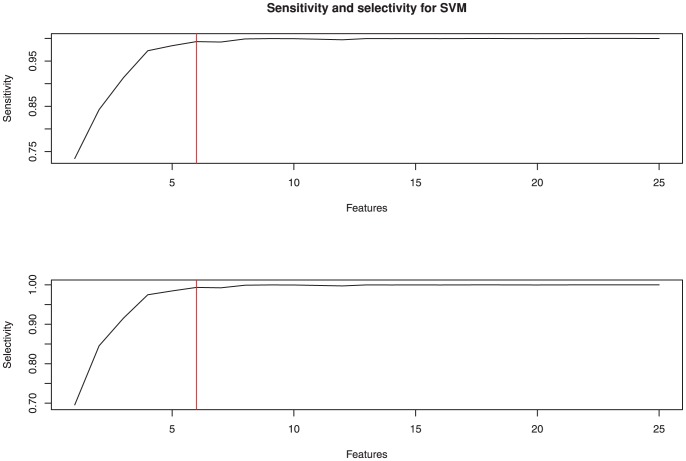
Major depression is a prevalent disorder that imposes a significant burden on society, yet objective laboratory-style tests to assist in diagnosis are lacking. We employed network-based analyses of "resting state" functional neuroimaging data to ascertain group differences in the endogenous cortical activity between healthy and depressed subjects.We additionally sought to use machine learning techniques to explore the ability of these network-based measures of resting state activity to provide diagnostic information for depression. Resting state fMRI data were acquired from twenty two depressed outpatients and twenty two healthy subjects matched for age and gender. These data were anatomically parcellated and functional connectivity matrices were then derived using the linear correlations between the BOLD signal fluctuations of all pairs of cortical and subcortical regions.We characterised the hierarchical organization of these matrices using network-based matrics, with an emphasis on their mid-scale "modularity" arrangement. Whilst whole brain measures of organization did not differ between groups, a significant rearrangement of their community structure was observed. Furthermore we were able to classify individuals with a high level of accuracy using a support vector machine, primarily through the use of a modularity-based metric known as the participation index.In conclusion, the application of machine learning techniques to features of resting state fMRI network activity shows promising potential to assist in the diagnosis of major depression, now suggesting the need for validation in independent data sets.
Conflict of interest statement
Figures
Similar articles
-
Identifying patients with Alzheimer's disease using resting-state fMRI and graph theory.Clin Neurophysiol. 2015 Nov;126(11):2132-41. doi: 10.1016/j.clinph.2015.02.060. Epub 2015 Apr 1. Clin Neurophysiol. 2015. PMID: 25907414
-
Functional connectivity markers of depression in advanced Parkinson's disease.Neuroimage Clin. 2020;25:102130. doi: 10.1016/j.nicl.2019.102130. Epub 2019 Dec 13. Neuroimage Clin. 2020. PMID: 31869768 Free PMC article.
-
Identifying major depressive disorder using Hurst exponent of resting-state brain networks.Psychiatry Res. 2013 Dec 30;214(3):306-12. doi: 10.1016/j.pscychresns.2013.09.008. Epub 2013 Oct 7. Psychiatry Res. 2013. PMID: 24113289
-
Increased sensitivity to age-related differences in brain functional connectivity during continuous multiple object tracking compared to resting-state.Neuroimage. 2017 Mar 1;148:364-372. doi: 10.1016/j.neuroimage.2017.01.048. Epub 2017 Jan 20. Neuroimage. 2017. PMID: 28111190
-
Sample heterogeneity in unipolar depression as assessed by functional connectivity analyses is dominated by general disease effects.J Affect Disord. 2017 Nov;222:79-87. doi: 10.1016/j.jad.2017.06.055. Epub 2017 Jun 27. J Affect Disord. 2017. PMID: 28679115
Cited by
-
Combining classification with fMRI-derived complex network measures for potential neurodiagnostics.PLoS One. 2013 May 6;8(5):e62867. doi: 10.1371/journal.pone.0062867. Print 2013. PLoS One. 2013. PMID: 23671641 Free PMC article.
-
Temporal exponential random graph models of longitudinal brain networks after stroke.J R Soc Interface. 2022 Mar;19(188):20210850. doi: 10.1098/rsif.2021.0850. Epub 2022 Mar 2. J R Soc Interface. 2022. PMID: 35232279 Free PMC article.
-
Applications of community detection techniques to brain graphs: Algorithmic considerations and implications for neural function.Proc IEEE Inst Electr Electron Eng. 2018 May;106(5):846-867. doi: 10.1109/JPROC.2017.2786710. Epub 2018 Feb 1. Proc IEEE Inst Electr Electron Eng. 2018. PMID: 30559531 Free PMC article.
-
Single subject prediction of brain disorders in neuroimaging: Promises and pitfalls.Neuroimage. 2017 Jan 15;145(Pt B):137-165. doi: 10.1016/j.neuroimage.2016.02.079. Epub 2016 Mar 21. Neuroimage. 2017. PMID: 27012503 Free PMC article. Review.
-
Resting-State Functional Network Scale Effects and Statistical Significance-Based Feature Selection in Machine Learning Classification.Comput Math Methods Med. 2019 Nov 4;2019:9108108. doi: 10.1155/2019/9108108. eCollection 2019. Comput Math Methods Med. 2019. PMID: 31781290 Free PMC article.
References
-
- Perezstable EJ, Miranda J, Munoz RF, Ying YW (1990) Depression in medical outpatients - underrecognition and misdiagnosis. Archives of Internal Medicine 150: 1083–1088. - PubMed
-
- Coyne JC, Schwenk TL, Fechnerbates S (1995) Nondetection of depression by primary-care physicians reconsidered. General Hospital Psychiatry 17: 3–12. - PubMed
Publication types
MeSH terms
LinkOut - more resources
Full Text Sources
Other Literature Sources
Medical
