. 2012;7(8):e42563.
doi: 10.1371/journal.pone.0042563. Epub 2012 Aug 16.

Rho GTPase expression in human myeloid cells

Affiliations

Rho GTPase expression in human myeloid cells

Suzanne F G van Helden et al. PLoS One. 2012.

Abstract

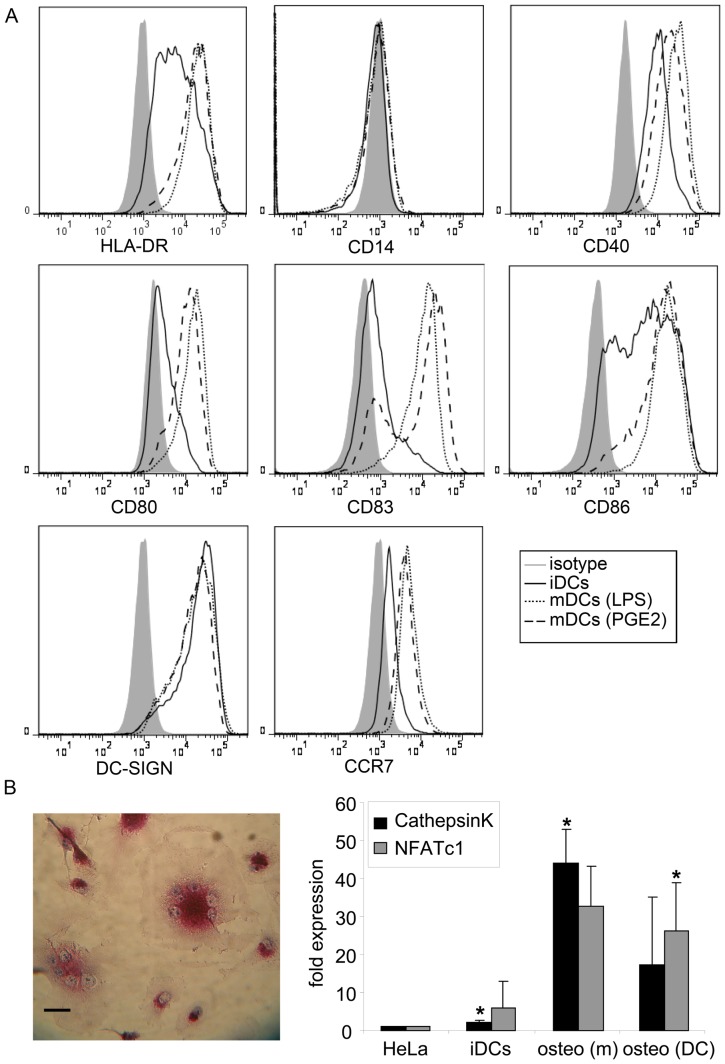
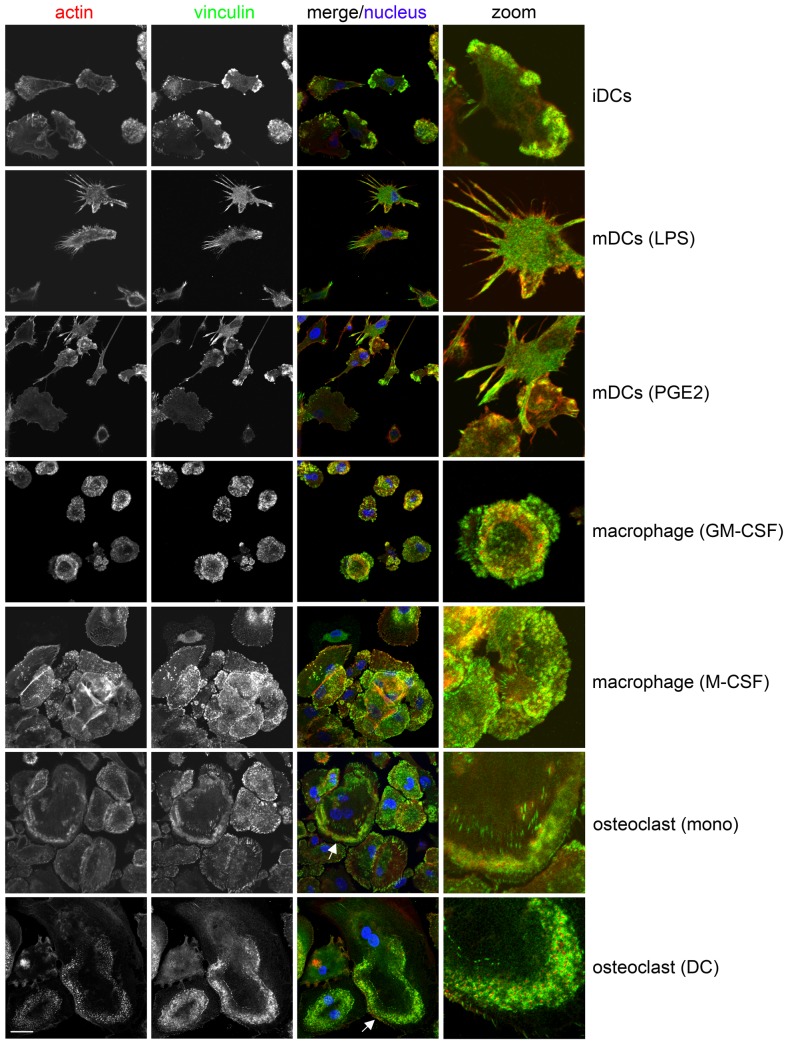
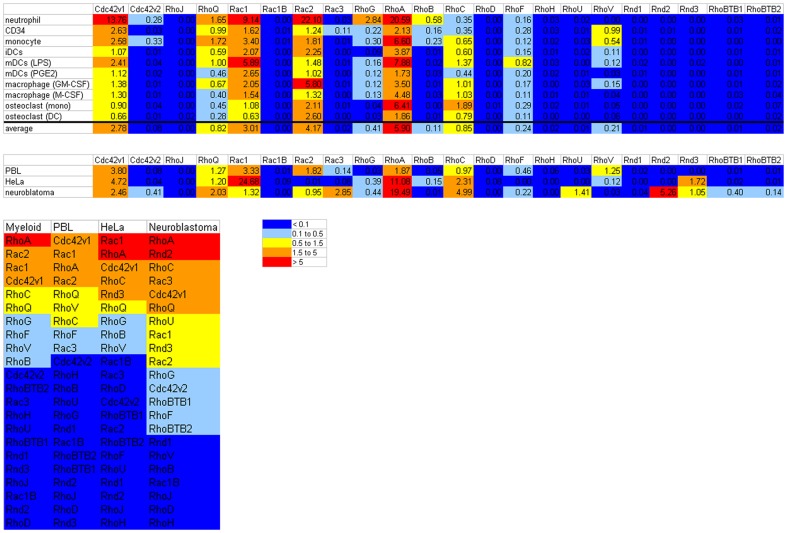
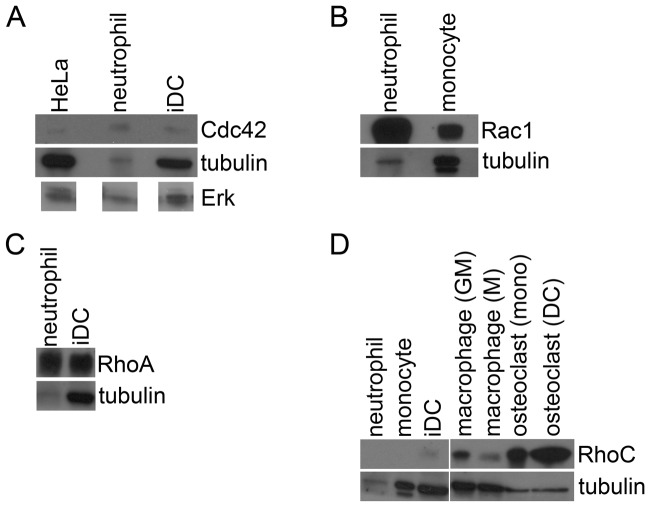
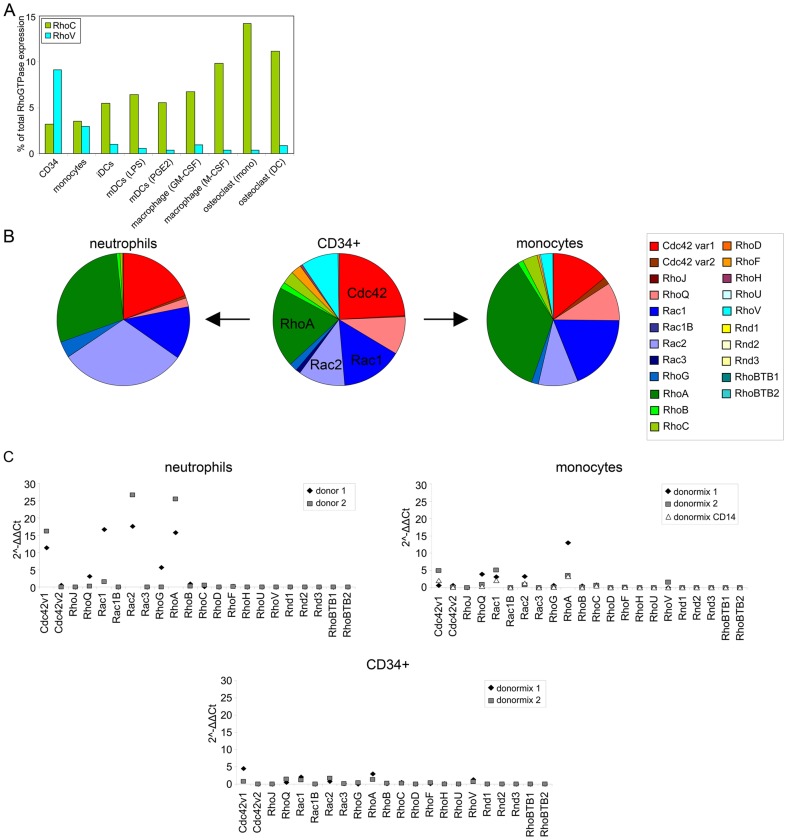
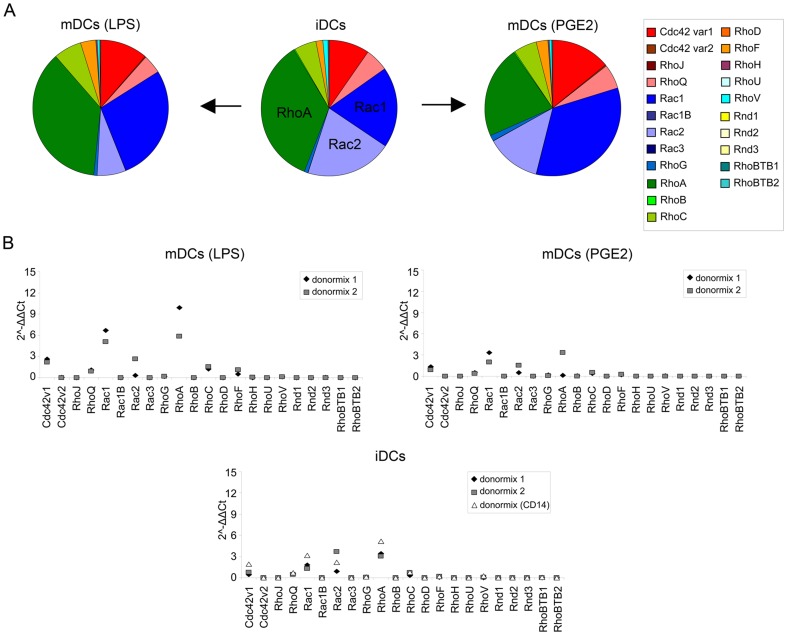
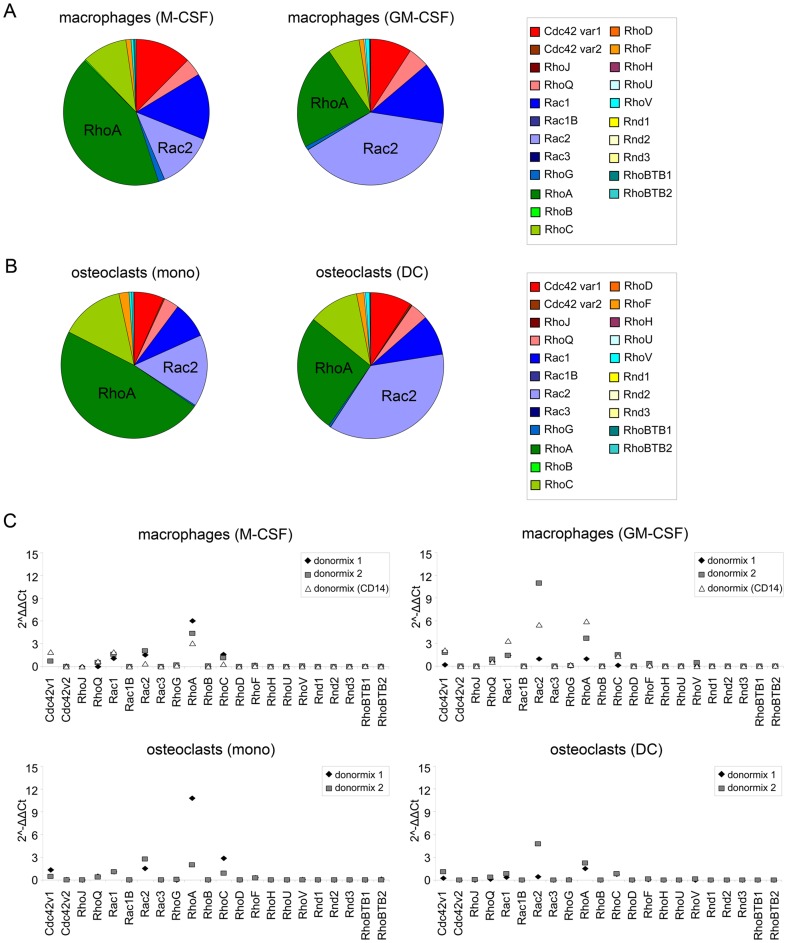
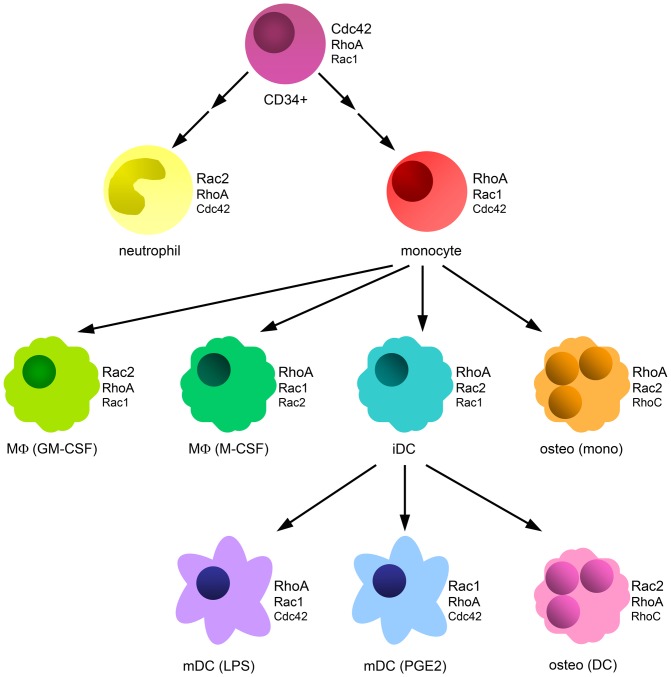
Myeloid cells are critical for innate immunity and the initiation of adaptive immunity. Strict regulation of the adhesive and migratory behavior is essential for proper functioning of these cells. Rho GTPases are important regulators of adhesion and migration; however, it is unknown which Rho GTPases are expressed in different myeloid cells. Here, we use a qPCR-based approach to investigate Rho GTPase expression in myeloid cells.We found that the mRNAs encoding Cdc42, RhoQ, Rac1, Rac2, RhoA and RhoC are the most abundant. In addition, RhoG, RhoB, RhoF and RhoV are expressed at low levels or only in specific cell types. More differentiated cells along the monocyte-lineage display lower levels of Cdc42 and RhoV, while RhoC mRNA is more abundant. In addition, the Rho GTPase expression profile changes during dendritic cell maturation with Rac1 being upregulated and Rac2 downregulated. Finally, GM-CSF stimulation, during macrophage and osteoclast differentiation, leads to high expression of Rac2, while M-CSF induces high levels of RhoA, showing that these cytokines induce a distinct pattern. Our data uncover cell type specific modulation of the Rho GTPase expression profile in hematopoietic stem cells and in more differentiated cells of the myeloid lineage.


Conflict of interest statement

Competing Interests: The authors have declared that no competing interests exist.

Figures

Figure 1
Figure 1. Confirmation of cell differentiation.
(A) Flow cytometric analysis of immature and mature DCs. Filled graphs represent isotype controls (isotype), solid lines represent immature DCs (iDCs), dotted lines represent LPS-matured DCs (mDCs (LPS)) and dashed lines represent PGE2-matured DCs (mDCs (PGE2)). Surface expression of the monocyte marker CD14 is low. HLA-DR and DC-SIGN are highly expressed. The costimulatory molecules CD40, CD80 and CD86 are upregulated during differentiation. The maturation markers CD83 and CCR7 are expressed upon maturation. (B) Corfirmation of osteoclast generation. The left panel shows a TRACP staining of osteoclasts. Images were obtained using a Zeiss LSM 510-meta microscope with a Plan-Apochromatic 63× 1.4 NA oil immersion objective (Carl Zeiss, Jena, Germany) in combination with a camera (Pentax Europe GmbH, Germany). The magenta staining shows the presence of tartrate-resistant phosphate in the osteoclasts generated from monocytes. In addition, the multiple nuclei can be seen in blue. Representative image is shown. Scale bar; 20 µm. In the bar graph, the expression of the osteoclasts markers cathepsinK and NFATc1 is depicted as compared to expression in HeLa (fold expression). The expression of cathepsinK and NFATc1 was analyzed (n = 3) in HeLa, immature DCs (iDCs), monocyte-derived osteoclasts (osteo (m)) and DC-derived osteoclasts (osteo (DC)). The expression of these markers is upregulated in osteoclasts. * indicates significant difference from HeLa; p<0.05. Together, this shows the successful generation of osteoclasts.
Figure 2
Figure 2. Morphology of differentiated myeloid cells on fibronectin.
The cells are seeded on fibronectin-coated coverslips and stained for vinculin (green, second column). Phalloidin Texas Red (red, first column) is used to detect F-actin and Hoechst33258 is used to visualize nuclei (blue, third column). Images were obtained by confocal microscopy using a Zeiss LSM 510-meta microscope with a Plan-Apochromatic 63× 1.4 NA oil immersion objective (Carl Zeiss, Jena, Germany) and analyzed using Zen software (Carl Zeiss). The third column shows the merged image and the fourth column shows a zoom of a part of the merge image. Podosomes can be seen as actin dots surrounded by vinculin rings. In the osteoclasts podosome rings (arrows) can be observed. iDCs; immature DCs, mDCs (LPS); LPS-matured DCs, mDCs (PGE2); PGE2-matured DCs. Representative images are shown. Scale bar; 20 µm.
Figure 3
Figure 3. General expression pattern of Rho GTPases in myeloid cells.
The mRNA expression of the Rho GTPases is depicted as the average 2−ΔΔCt value per Rho GTPases for the individual cell types and averaged for myeloid cells (upper panel) and for the control cell types, i.e. PBLs, HeLa and neuroblastoma cells (second panel). CD34; CD34+ cells, iDCs; immature DCs, mDCs (LPS); LPS-matured DCs, mDCs (PGE2); PGE2-matured DCs. Expression of the Rho GTPases in each cell type was determined in 2 or 3 different donors or donormixes (see Materials and Methods). The colors mark the expression level. The lower panel shows a ranking of the Rho GTPase expression in myeloid cells and in the control cell types.
Figure 4
Figure 4. Expression of Rho GTPases on protein level.
Western blots showing the protein levels of Cdc42, Rac1, RhoA and RhoC compared to tubulin. The levels of tubulin are comparable except for neutrophils where there is less protein loaded. (A) Protein expression of Cdc42. The expression of Cdc42 is compared to tubulin and total ERK. The levels of ERK are comparable to the tubulin levels. Depicted ERK bands were derived from one and the same western blot. Cdc42 protein expression is higher in neutrophils than in HeLa or immature DCs (iDC). (B) Protein levels of Rac1. Rac1 expression is higher in neutrophils than in monocytes. (C) Protein expression of RhoA. RhoA expression is higher in neutrophils than in immature DCs (iDC). (D) Protein levels of RhoC. RhoC expression is low in neutrophils (although the tubulin level is also low) and monocytes. Some expression is observed in immature DCs (iDC), while prominent expression is observed in macrophages differentiated with GM-CSF (GM) or M-CSF (M) and in osteoclasts derived from monocytes (mono) or DC (DC).
Figure 5
Figure 5. Rho GTPase expression compared in progenitor cells and differentiated myeloid cells.
(A) Expression pattern of RhoC and RhoV in the monocyte-lineage. The expression of RhoC and RhoV are depicted as a percentage of total Rho GTPase expression. The expression of RhoC is lowest in CD34+ cells, low in monocytes and increases during differentiation of monocytes, while RhoV displays an inverse expression pattern. CD34; CD34+ cells, iDCs; immature DCs, mDCs (LPS); LPS-matured DCs, mDCs (PGE2); PGE2-matured DCs. (B) Rho GTPase expression in CD34+ cells, neutrophils and monocytes. The percentage of total Rho GTPase expression is depicted for each cell type in a pie chart. Rho GTPase subfamilies and individual Rho GTPases are color coded (for example Rho subfamily is green and RhoA is dark green). (C) The 2−ΔΔCt values of the Rho GTPases in CD34+ cells, neutrophils and monocytes. The 2−ΔΔCt values of the individual data points for each cell type are depicted. Donormix 1 and 2 are derived from 9 and 3 donors, resp. Donormix CD14 is derived from the same donors as donormix 2, but monocytes were obtained by elutriation followed by CD14 MACS isolation.
Figure 6
Figure 6. Rho GTPase expression during DC maturation.
(A) Rho GTPase expression in DCs during maturation with LPS or PGE2. The percentage of total Rho GTPase expression is depicted for each DC in a pie chart. Rho GTPase subfamilies and individual Rho GTPases are color coded. iDCs; immature DCs, mDCs (LPS); LPS-matured DCs, mDCs (PGE2); PGE2-matured DCs. (B) The 2−ΔΔCt values of the Rho GTPases in immature and mature DCs. The 2−ΔΔCt values of the individual data points for each cell type are depicted. Donormix 1 and 2 are derived from 9 and 3 donors, resp. Donormix CD14 is derived from the same donors as donormix 2, but monocytes were obtained by elutriation followed by CD14 MACS isolation and differentiated to DCs. iDCs; immature DCs, mDCs (LPS); LPS-matured DCs, mDCs (PGE2); PGE2-matured DCs.
Figure 7
Figure 7. Rho GTPase expression in macrophages and osteoclasts.
(A) Rho GTPase expression in macrophages generated with M-CSF or GM-CSF. The percentage of total Rho GTPase expression is depicted for each macrophage type in a pie chart. Rho GTPase subfamilies and individual Rho GTPases are color coded. (B) Rho GTPase expression in osteoclasts generated from monocytes or DCs. The percentage of total Rho GTPase expression is depicted for each osteoclast type in a pie diagram. Rho GTPase subfamilies and individual Rho GTPases are color coded. (C) The 2−ΔΔCt values of the Rho GTPases in macrophages and osteoclasts. The 2−ΔΔCt values of the individual data points for each cell type are depicted. Donormix 1 and 2 are derived from 9 and 3 donors, resp. Donormix CD14 is derived from the same donors as donormix 2, but monocytes were obtained by elutriation followed by CD14 MACS isolation and differentiated to macrophages.
Figure 8
Figure 8. Overview of most abundant Rho GTPases per cell type.
The different cells investigated in this study are depicted with the three most highly expressed Rho GTPases next to them. CD34+; CD34+ cell, MΦ (GM-CSF); macrophage differentiated with GM-CSF, MΦ (M-CSF); macrophage differentiated with M-CSF, iDC; immature DC, osteo (mono); osteoclast differentiated from monocyte, mDC (LPS); LPS-matured DC, mDC (PGE2); PGE2-matured DC, osteo (DC); osteoclast differentiated from DC. An arrow indicates that a cell type is differentiated from the cell type at the start of the arrow. Two arrows between CD34+ and monocyte or neutrophil indicate that the monocytes and neutrophils are not directly differentiated from CD34+ cells, but that there are intermediate cells in between.

References

    1. Banchereau J, Steinman RM (1998) Dendritic cells and the control of immunity. Nature 392: 245–252. - PubMed
    1. Moon SY, Zheng Y (2003) Rho GTPase-activating proteins in cell regulation. Trends Cell Biol 13: 13–22. - PubMed
    1. Rossman KL, Der CJ, Sondek J (2005) GEF means go: turning on RHO GTPases with guanine nucleotide-exchange factors. Nat Rev Mol Cell Biol 6: 167–180. - PubMed
    1. DerMardirossian C, Bokoch GM (2005) GDIs: central regulatory molecules in Rho GTPase activation. Trends Cell Biol 15: 356–363. - PubMed
    1. Dallery E, Galiegue-Zouitina S, Collyn-d'Hooghe M, Quief S, Denis C, et al. (1995) TTF, a gene encoding a novel small G protein, fuses to the lymphoma-associated LAZ3 gene by t(3;4) chromosomal translocation. Oncogene 10: 2171–2178. - PubMed

Publication types

MeSH terms

Substances