Attentive and pre-attentive processes in change detection and identification
- PMID: 22916170
- PMCID: PMC3420879
- DOI: 10.1371/journal.pone.0042851
Attentive and pre-attentive processes in change detection and identification
Abstract
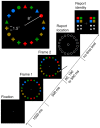
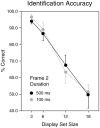
In studies of change blindness, observers often have the phenomenological impression that the blindness is overcome all at once, so that change detection, localization and identification apparently occur together. Three experiments are described that explore dissociations between these processes using a discrete trial procedure in which 2 visual frames are presented sequentially with no intervening inter-frame-interval. The results reveal that change detection and localization are essentially perfect under these conditions regardless of the number of elements in the display, which is consistent with the idea that change detection and localization are mediated by pre-attentive parallel processes.In contrast, identification accuracy for an item before it changes is generally poor, and is heavily dependent on the number of items displayed. Identification accuracy after a change is substantially better, but depends on the new item's duration. This suggests that the change captures attention, which substantially enhances the likelihood of correctly identifying the new item. However, the results also reveal a limited capacity to identify unattended items. Specifically, we provide evidence that strongly suggests that, at least under these conditions, observers were able to identify two items without focused attention. Our results further suggest that spatial pre-cues that attract attention to an item before the change occurs simply ensure that the cued item is one of the two whose identity is encoded.
Conflict of interest statement
Figures


Similar articles
-
Change detection on a hunch: pre-attentive vision allows "sensing" of unique feature changes.Atten Percept Psychophys. 2015 Nov;77(8):2570-88. doi: 10.3758/s13414-015-0963-9. Atten Percept Psychophys. 2015. PMID: 26353860
-
Cortical fMRI activation produced by attentive tracking of moving targets.J Neurophysiol. 1998 Nov;80(5):2657-70. doi: 10.1152/jn.1998.80.5.2657. J Neurophysiol. 1998. PMID: 9819271
-
The role of iconic memory in change-detection tasks.Perception. 2000;29(3):273-86. doi: 10.1068/p3035. Perception. 2000. PMID: 10889938
-
Failures to see: attentive blank stares revealed by change blindness.Conscious Cogn. 2008 Sep;17(3):877-86. doi: 10.1016/j.concog.2007.08.006. Epub 2007 Oct 10. Conscious Cogn. 2008. PMID: 17931887
-
Neural correlates of pre-attentive and attentive processing of visual changes.Neuroreport. 2005 Dec 19;16(18):2061-4. doi: 10.1097/00001756-200512190-00019. Neuroreport. 2005. PMID: 16317355
Cited by
-
Electrophysiological correlates of encoding processes in a full-report visual working memory paradigm.Cogn Affect Behav Neurosci. 2018 Apr;18(2):353-365. doi: 10.3758/s13415-018-0574-8. Cogn Affect Behav Neurosci. 2018. PMID: 29446044 Free PMC article.
-
The steady-state visual evoked potential reveals neural correlates of the items encoded into visual working memory.Neuropsychologia. 2014 Oct;63:145-53. doi: 10.1016/j.neuropsychologia.2014.08.020. Epub 2014 Aug 28. Neuropsychologia. 2014. PMID: 25173712 Free PMC article.
-
A Metacognitive Perspective of Visual Working Memory With Rich Complex Objects.Front Psychol. 2020 Feb 25;11:179. doi: 10.3389/fpsyg.2020.00179. eCollection 2020. Front Psychol. 2020. PMID: 32158411 Free PMC article.
-
Humans, fish, spiders and bees inherited working memory and attention from their last common ancestor.Front Psychol. 2023 Feb 6;13:937712. doi: 10.3389/fpsyg.2022.937712. eCollection 2022. Front Psychol. 2023. PMID: 36814887 Free PMC article.
References
-
- Becker MW, Pashler H, Anstis SM (2000) The role of iconic memory in change-detection tasks. Perception 29 3 273–86. - PubMed
-
- Rensink RA (2002) Change detection. Ann Rev Psychol 53: 245–277. - PubMed
-
- Turatto M, Bridgeman B (2005) Change perception using visual transients: object substitution and deletion. Exp Brain Res 167: 595–608. - PubMed
-
- Becker MW, Vera S (2007) Attentional filtering of transients allows for a recovery from change blindness. Perception 36 8: 179–190. - PubMed
-
- Posner MI, Snyder CR, Davidson BJ (1980) Attention and the detection of signals. J Exp Psych 109 2: 160–174. - PubMed
Publication types
MeSH terms
LinkOut - more resources
Full Text Sources

