. 2012;7(8):e42878.
doi: 10.1371/journal.pone.0042878. Epub 2012 Aug 14.

Developmental alterations in motor coordination and medium spiny neuron markers in mice lacking pgc-1α

Affiliations

Developmental alterations in motor coordination and medium spiny neuron markers in mice lacking pgc-1α

Elizabeth K Lucas et al. PLoS One. 2012.

Abstract

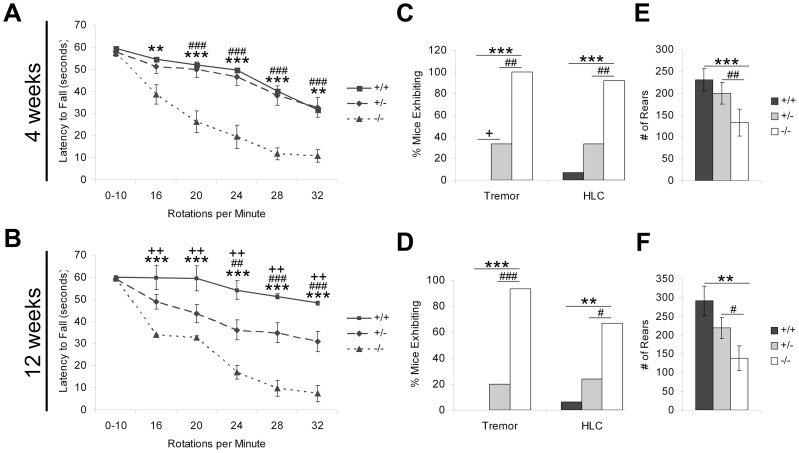
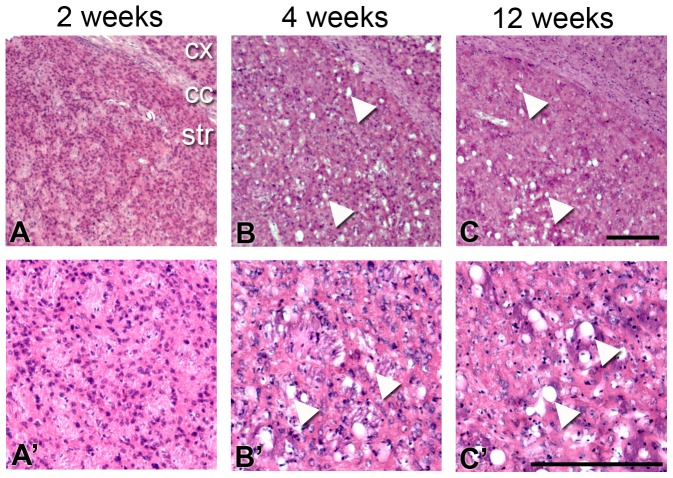
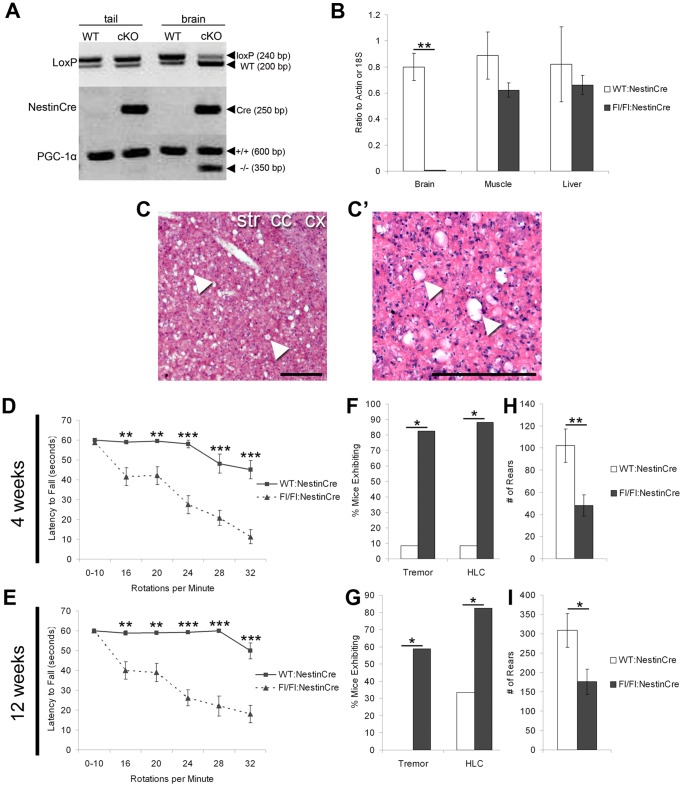
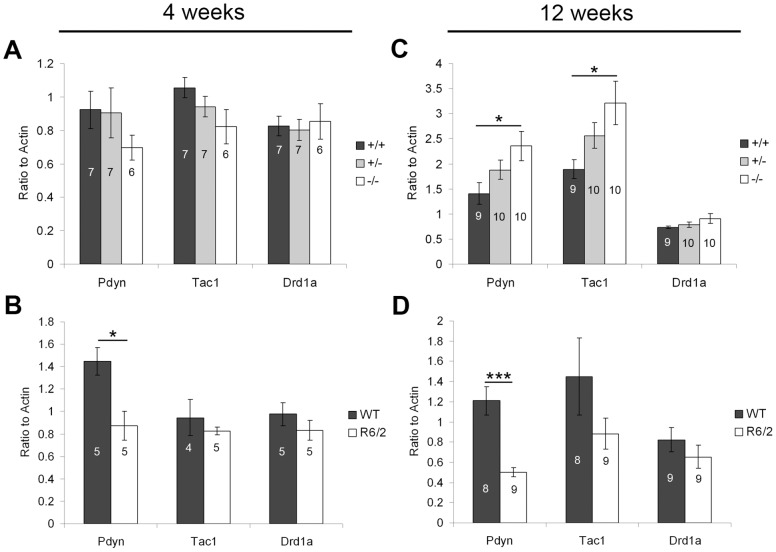
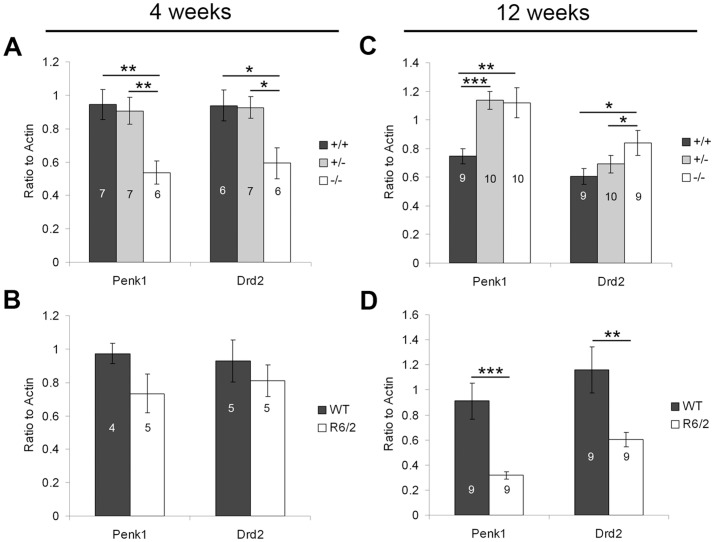
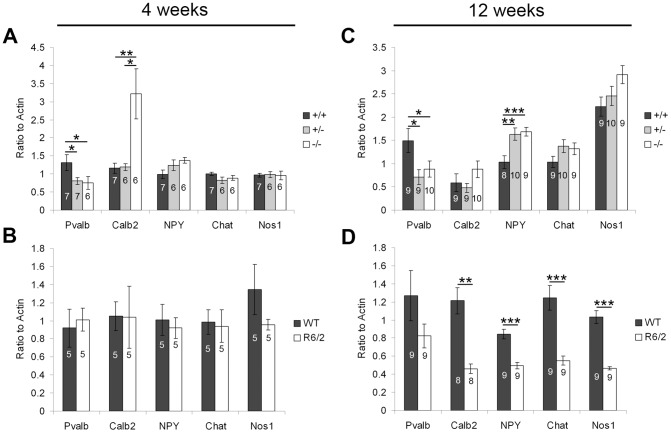
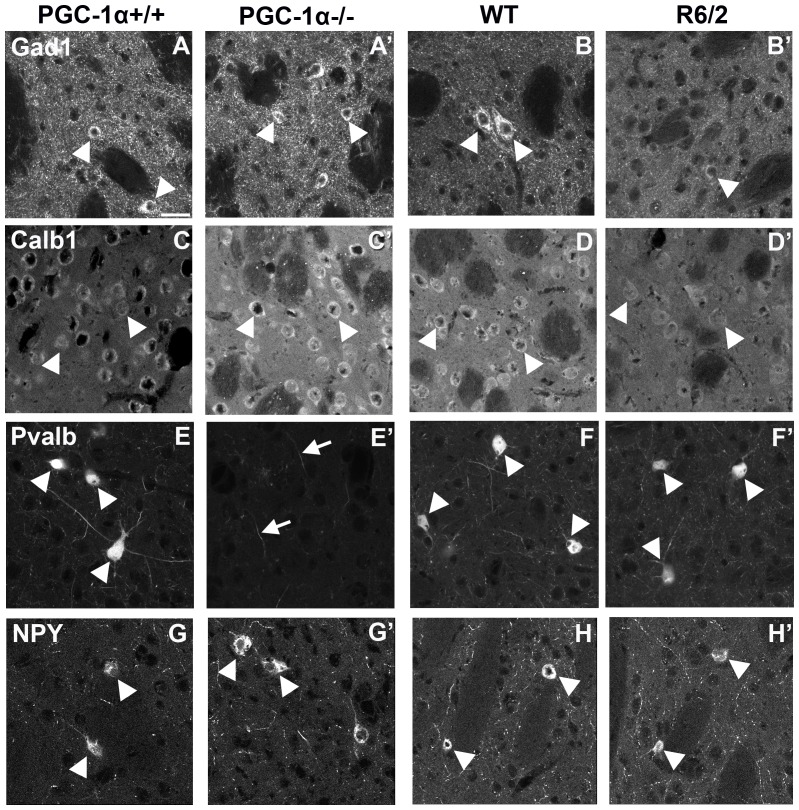
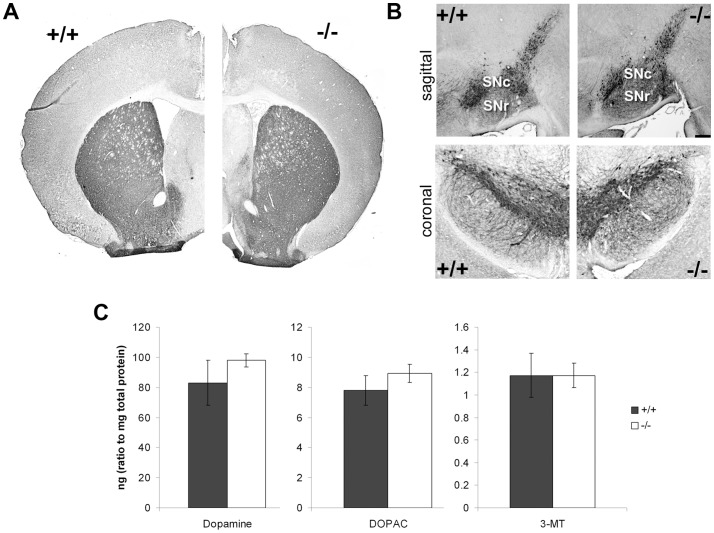
Accumulating evidence implicates the transcriptional coactivator peroxisome proliferator activated receptor γ coactivator 1α (PGC-1α) in the pathophysiology of Huntington Disease (HD). Adult PGC-1α (-/-) mice exhibit striatal neurodegeneration, and reductions in the expression of PGC-1α have been observed in striatum and muscle of HD patients as well as in animal models of the disease. However, it is unknown whether decreased expression of PGC-1α alone is sufficient to lead to the motor phenotype and striatal pathology characteristic of HD. For the first time, we show that young PGC-1α (-/-) mice exhibit severe rotarod deficits, decreased rearing behavior, and increased occurrence of tremor in addition to the previously described hindlimb clasping. Motor impairment and striatal vacuolation are apparent in PGC-1α (-/-) mice by four weeks of age and do not improve or decline by twelve weeks of age. The behavioral and pathological phenotype of PGC-1α (-/-) mice can be completely recapitulated by conditional nervous system deletion of PGC-1α, indicating that peripheral effects are not responsible for the observed abnormalities. Evaluation of the transcriptional profile of PGC-1α (-/-) striatal neuron populations and comparison to striatal neuron profiles of R6/2 HD mice revealed that PGC-1α deficiency alone is not sufficient to cause the transcriptional changes observed in this HD mouse model. In contrast to R6/2 HD mice, PGC-1α (-/-) mice show increases in the expression of medium spiny neuron (MSN) markers with age, suggesting that the observed behavioral and structural abnormalities are not primarily due to MSN loss, the defining pathological feature of HD. These results indicate that PGC-1α is required for the proper development of motor circuitry and transcriptional homeostasis in MSNs and that developmental disruption of PGC-1α leads to long-term alterations in motor functioning.


Conflict of interest statement

Competing Interests: The authors have declared that no competing interests exist.

Figures

Figure 1
Figure 1. Severe motor impairment in PGC-1α −/− mice.
PGC-1α +/+, +/−, and −/− littermates were assessed for motor coordination with rotarod analysis, for the presence or absence of tremor and hindlimb clasping (HLC), and for alterations in locomotor activity with open field monitoring at four and twelve weeks of age. A. At four weeks, PGC-1α −/− mice had a significantly decreased latency to fall off the rotarod apparatus compared to +/+ and +/− mice at speeds of 16, 20, 24, 28, and 32 rotations per minute. B. By twelve weeks of age, +/−, in addition to −/−, mice were significantly impaired on the rotarod task compared to +/+ animals. C. At four weeks, PGC-1α −/− and +/− mice had significantly increased instance of tremor compared to +/+ mice. PGC-1α −/−, but not +/−, mice had increased instance of HLC. D. PGC-1α −/−, but not +/−, animals had increased instance of tremor and HLC at twelve weeks. E–F. PGC-1α −/− mice exhibited fewer rears in the open field paradigm compared to +/+ and +/− littermates at four (E) and twelve (F) weeks of age. Other open field measures, including ambulatory distance and time, did not differ among genotypes. For A–B, repeated-measures ANOVA followed by planned comparisons with the Holm-Bonferroni correction. * +/+ versus −/−. + +/+ versus +/−. # +/− versus −/−. For C–D, chi-square tests for independence. For E–F, one-way ANOVA followed by Fisher's LSD. One symbol, p<0.05. Two symbols, p<0.005. Three symbols, p<0.0005. +/+ n = 17, +/− n = 25, −/− n = 15. Data presented as mean ± SEM.
Figure 2
Figure 2. Early postnatal development of spongiform vacuolation in PGC-1α −/− striatum.
Hematoxylin and eosin (H&E) stained coronal sections from PGC-1α −/− mice at two, four, and twelve weeks demonstrate the appearance of vacuoles between two weeks (A; no vacuoles present) and four weeks (B; arrowheads) of age. Notably, vacuoles do not appear to increase in size or number between four weeks and twelve weeks (C) of age, indicating that neurodegeneration does not progress as animals transition from the early postnatal period to adulthood. No vacuoles were observed in age-matched PGC-1α +/+ littermates (data not shown). A′–C′ are higher power images from the sections in A–C. Cx, cortex. Cc, corpus callosum. Str, striatum. Scale bars = 250 µm.
Figure 3
Figure 3. Nervous system deletion of PGC-1α recapitulates the behavioral and neurodegenerative phenotype of PGC-1α −/− mice.
Nervous system conditional knockout (cKO) of PGC-1α was mediated by crossing PGC-1αfl/fl mice with mice expressing cre recombinase driven by the nestin promoter. A. Qualitative PCR from genomic DNA from homogenized tail or brain tissue demonstrates that recombination occurs in PGC-1αfl/+:NestinCre brain but not tail tissue. B. q-RT-PCR confirmed that PGC-1α transcript expression is significantly reduced in brain but not muscle or liver of PGC-1αfl/fl:NestinCre compared to WT:NestinCre animals. C. Hematoxylin and eosin (H&E) stained coronal sections from twelve-week-old PGC-1αfl/fl:NestinCre mice demonstrate spongiform vacuolation in the striatum. No vacuoles were present in PGC-1αWT:NestinCre littermates (data not shown). Higher magnification image shown in B′. Cx, cortex. Cc, corpus callosum. Str, striatum. Scale bars = 250 µm. D–E. PGC-1αfl/fl:NestinCre mice displayed impaired motor coordination with a decreased latency to fall off the of rotarod compared to PGC-1αWT:NestinCre at speeds of 16–32 rotations per minute at four (C) and twelve (D) weeks of age. F–G. PGC-1αfl/fl:NestinCre exhibited increased instance of tremor and hindlimb clasping (HLC) compared to PGC-1αWT:NestinCre mice at four (E) and twelve (F) weeks of age. H–I. PGC-1αfl/fl:NestinCre mice reared fewer times during a 30-minute open field protocol compared to PGC-1αWT:NestinCre littermates at four (G) and twelve (H) weeks of age. Other behaviors of interest, including ambulatory distance and time, did not differ between genotypes at either age. D–E, repeated-measure ANOVA followed by planned comparisons with the Holm-Bonferroni correction. F–G, chi square test for independence. B;H–I, two-tailed t-tests. *p<0.05. **p<0.005. *** p<0.0005. PGC-1αWT:NestinCre, n = 12; PGC-1αfl/fl:NestinCre, n = 18. Data presented as mean ± SEM.
Figure 4
Figure 4. Transcriptional profile of general striatal projection markers.
Gene expression of Gad67 (Gad1), calbindin (Calb1), and μ opioid receptor (Oprm) was measured in striatum of PGC-1α and R6/2 HD mice and littermate controls at four and twelve weeks using q-RT-PCR. No changes were found in mice lacking PGC-1α (A), but the striosome marker Oprm was significantly increased in R6/2 compared to WT mice (B) at four weeks of age. By twelve weeks of age, the matrix marker Calb1 and the striosome marker Oprm were significantly increased in PGC-1α +/− and −/− compared to +/+ mice (C), and Gad1 was significantly decreased in R6/2 HD mice (D). For A and C, one-way ANOVA followed by Fisher's LSD. For B and D, two-tailed t-tests. *p<0.05. **p<0.005. n/group indicated on histograms. Data presented as mean ± SEM.
Figure 5
Figure 5. Transcriptional profile of direct pathway markers.
Gene expression of prodynorphin (Pdyn), substance P (Tac1), and dopamine receptor 1a (Drd1a) was measured in striatum of PGC-1α and R6/2 HD mice and littermate controls at four and twelve weeks using q-RT-PCR. A. At four weeks of age, no changes in direct pathway transcripts were observed in PGC-1α −/− mice. B. A significant decrease in Pdyn was observed in R6/2 striatum at this age. C. By twelve weeks of age, expression of Pdyn and Tac1 were significantly increased in PGC-1α −/− compared to +/+ mice. D. Pdyn was still significantly decreased in R6/2 HD mice at this age. For A and C, one-way ANOVA followed by Fisher's LSD. For B and D, two-tailed t-tests. *p<0.05. n/group indicated on histograms. Data presented as mean ± SEM.
Figure 6
Figure 6. Transcriptional profile of indirect pathway markers.
Gene expression of preproenkephalin (Penk1) and dopamine receptor 2 (Drd2) was measured in striatum of PGC-1α and R6/2 HD mice and littermate controls at four and twelve weeks using q-RT-PCR. A. At four weeks of age, expression of Penk1 and Drd2 was significantly decreased in PGC-1α −/− compared to +/+ and +/− mice. B. No changes were observed in R6/2 HD mice at this age. C. By twelve weeks of age, Penk1 was significantly increased in PGC-1α −/− and +/− compared to +/+ mice, and Drd2 was significantly increased in PGC-1α −/− compared to +/+ and +/− mice. D. Both Penk1 and Drd2 were significantly decreased in R6/2 HD mice at this age. For A and C, one-way ANOVA followed by Fisher's LSD. For B and D, two-tailed t-tests. *p<0.05. **p<0.005. ***p<0.0005. n/group indicated on histograms. Data presented as mean ± SEM.
Figure 7
Figure 7. Transcriptional profile of interneuron markers.
Gene expression of parvalbumin (Pvalb), calretinin (Calb2), neuropeptide Y (NPY), choline acetyltransferase (Chat), and neuronal nitric oxide synthase (Nos1) was measured in striatum of PGC-1α and R6/2 HD mice and littermate controls at four and twelve weeks using q-RT-PCR. A. At four weeks of age, Pvalb was significantly decreased in PGC-1α −/− and +/− compared to +/+ mice, and Calb2 was significantly increased in PGC-1α −/− compared to +/+ and +/− mice. B. No changes in interneuron markers were observed in R6/2 HD mice at this age. C. At twelve weeks of age, Pvalb was still significantly decreased in PGC-1α −/− and +/− compared to +/+ mice, and expression of NPY was significantly increased in −/− and +/− compared to +/+ mice. D. In the R6/2, all interneuron markers except Pvalb were significantly decreased at this age. For A and C, one-way ANOVA followed by Fisher's LSD. For B and D, two-tailed t-tests. *p<0.05. **p<0.005. ***p<0.0005. n/group indicated on histograms. Data presented as mean ± SEM.
Figure 8
Figure 8. Evaluation of selected medium spiny neuron (MSN) and interneuron markers in the striatum of PGC-1α −/− and R6/2 mice.
Representative confocal images of coronal sections of the striatum stained with antibodies directed against Gad1 (A–B), Calb1 (C–D), Pvalb (E–F), and NPY (G–H) demonstrate that protein expression changes closely mirror those at the transcript level in PGC-1α +/+ and −/− and R6/2 and WT littermates. PGC-1α −/− mice exhibit no change in Gad1 expression (A′, arrowheads), while Calb1 (C′) and NPY (G′) expression was increased in cell bodies (arrowheads) and processes of PGC-1α −/− mice compared to +/+ mice (A,C,G). Pvalb was minimally expressed in PGC-1α −/− cell bodies (E′); however, some staining was still evident in processes (arrows). Notably, overall MSN and interneuron number did not appear to differ between PGC-1α +/+ and −/− mice. Expression of Gad1 (B′), Calb1 (D′), and NPY (H′) were reduced in R6/2 versus WT animals (B,D,H), while expression Pvalb remained unaltered (D–D′). Decreases in Gad1 and Calb1 appeared to reflect a loss of expressing cells as well as decreased expression in remaining cells (arrows), while decreases in NPY appeared solely to reflect a loss of expression within this cellular population (arrows) in the R6/2. Scale bar = 25 µm.
Figure 9
Figure 9. Loss of PGC-1α does not alter tyrosine hydroxylase or dopamine levels.
Immunohistochemistry for tyrosine hydroxylase (TH) and high performance liquid chromatography (HPLC) for dopamine and its metabolites were used as measures of dopamine in PGC-1α +/+ and −/− mice at twelve weeks of age. A–B. Representative low magnification pictures of immunohistochemistry with an antibody directed against TH revealed no differences in the distribution of immunoreactivity of axon fibers to the striatum (A) or cell bodies in the substantia nigra (B) in PGC-1α −/− mice. SNc, substantia nigra pars compacta; SNr, substantia nigra pars reticulata. Scale bars = 1 mm. C. Quantification of HPLC probing biogenic amines demonstrated that neither dopamine nor its metabolites (DOPAC and MT-3) are significantly altered in −/− mice. +/+, n = 4; −/−, n = 7. Data presented as mean ± SEM.

References

    1. The Huntington Disease Collaborative Research Group (1993) A novel gene containing a trinucleotide repeat that is expanded and unstable on Huntington's disease chromosomes. Cell 72: 971–983. - PubMed
    1. Cicchetti F, Prensa L, Wu Y, Parent A (2000) Chemical anatomy of striatal interneurons in normal individuals and in patients with Huntington's disease. Brain Res Brain Res Rev 34: 80–101. - PubMed
    1. Walker FO (2007) Huntington's Disease. Semin Neurol 27: 143–150. - PubMed
    1. Heng MY, Detloff PJ, Albin RL (2008) Rodent genetic models of Huntington disease. Neurobiol Dis 32: 1–9. - PubMed
    1. Lin MT, Beal MF (2006) Mitochondrial dysfunction and oxidative stress in neurodegenerative diseases. Nature 443: 787–795. - PubMed

Publication types

MeSH terms