. 2012;7(8):e43129.
doi: 10.1371/journal.pone.0043129. Epub 2012 Aug 15.

Three decades of farmed escapees in the wild: a spatio-temporal analysis of Atlantic salmon population genetic structure throughout Norway

Affiliations

Three decades of farmed escapees in the wild: a spatio-temporal analysis of Atlantic salmon population genetic structure throughout Norway

Kevin A Glover et al. PLoS One. 2012.

Abstract

Each year, hundreds of thousands of domesticated farmed Atlantic salmon escape into the wild. In Norway, which is the world's largest commercial producer, many native Atlantic salmon populations have experienced large numbers of escapees on the spawning grounds for the past 15-30 years. In order to study the potential genetic impact, we conducted a spatio-temporal analysis of 3049 fish from 21 populations throughout Norway, sampled in the period 1970-2010. Based upon the analysis of 22 microsatellites, individual admixture, F(ST) and increased allelic richness revealed temporal genetic changes in six of the populations. These changes were highly significant in four of them. For example, 76% and 100% of the fish comprising the contemporary samples for the rivers Vosso and Opo were excluded from their respective historical samples at P=0.001. Based upon several genetic parameters, including simulations, genetic drift was excluded as the primary cause of the observed genetic changes. In the remaining 15 populations, some of which had also been exposed to high numbers of escapees, clear genetic changes were not detected. Significant population genetic structuring was observed among the 21 populations in the historical (global F(ST) =0.038) and contemporary data sets (global F(ST) =0.030), although significantly reduced with time (P=0.008). This reduction was especially distinct when looking at the six populations displaying temporal changes (global F(ST) dropped from 0.058 to 0.039, P=0.006). We draw two main conclusions: 1. The majority of the historical population genetic structure throughout Norway still appears to be retained, suggesting a low to modest overall success of farmed escapees in the wild; 2. Genetic introgression of farmed escapees in native salmon populations has been strongly population-dependent, and it appears to be linked with the density of the native population.


Conflict of interest statement

Competing Interests: The authors have declared that no competing interests exist.

Figures

Figure 1
Figure 1. Norwegian rivers where historical and contemporary samples of Atlantic salmon populations were collected for the present study.
Figure 2
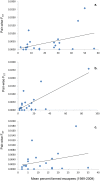
Figure 2. Relationship between average numbers of escapees observed in each population in the period 1989–2009, and the observed within-river temporal genetic changes as computed by pair-wise FST between the historical and contemporary sample.
Graph a = relationship when using an un-weighted mean of the farmed escapees recorded in the autumn survey data (R2 = 0.18, P = 0.052), graph b =  relationship when using a weighted mean based upon a mixture of summer sports fishing and autumn survey data (R2 = 0.56, P<0.0001) , and c = same as b with the population Opo excluded (R2 = 0.09, P = 0.20).
Figure 3
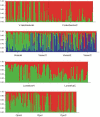
Figure 3. Bayesian clustering of historical (H), intermediate (I) and contemporary (C) samples representing the four rivers displaying the largest temporal genetic changes at 22 microsatellite loci.
For the river Vosso, a total of four samples were available. Thus, the two intermediate samples for this river include a suffix I1 and I2 (linking to these specific samples to Table 1). These analyses were conducted on each river separately. Inferred ancestry was computed using STRUCTURE v. 2.3.3 , , under a model assuming admixture and correlated allele frequencies without using population information. Ten runs with a burn-in period consisting of 100000 replications and a run length of 1000000 Markov chain Monte Carlo (MCMC) iterations were performed for a number of clusters ranging from K 1 to 5. Then an ad hoc summary statistic ΔK was used to calculate the number of clusters (K) that best fitted the data for each river separately. For full computation details and results for all populations using both 22 and 14 markers see Fig. S1 (supporting information).
Figure 4
Figure 4. Ratio between global FST computed among the 21 contemporary samples divided by the global FST computed among the 21 historical samples for 22 microsatellite markers.
Locus number is consequent with locus names and other locus-specific details available in Table S3.
Figure 5
Figure 5. Hierarchical Bayesian clustering for the historical and contemporary data sets for 21 populations genotyped at 22 microsatellite loci.
Inferred ancestry was computed using STRUCTURE v. 2.3.3 , , under a model assuming admixture and correlated allele frequencies without using population information. Ten runs with a burn-in period consisting of 100000 replications and a run length of 1000000 Markov chain Monte Carlo (MCMC) iterations were performed for a number of clusters ranging from K 1 to 5. Then, the ad hoc summary statistic ΔK was used to calculate the number of clusters (K) that best fitted the data. Populations are ordered North to South, thus corresponding with Tables 1 and 2. Barplots for K3 and K4 are presented for comparison between the historical and contemporary data sets (see results section). For full computation details and results using both 22 and 14 markers see Fig. S2 (supporting information).
Figure 6
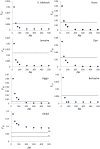
Figure 6. Simulations of genetic drift induced changes between the observed historical genetic profile and computed contemporary populations for each of the six populations displaying temporal genetic change.
Black diamonds represent the mean FST between the historical population and the computed contemporary population based upon 1000 simulations of genetic drift with Ne set to 25, 50, 75, 100, 200, 300, 400 and 500. Horizontal black line for each plot represents the observed pair-wise FST between the historical and contemporary population (i.e., the values given in Table 2). “Global” plot represents the global FST computed among these six populations based upon the above mentioned simulations, while the horizontal black bar H = historical global FST observed among these populations, and C  =  contemporary global FST observed among these populations (i.e., the values given in Table 3). Statistical significance levels for these comparisons are presented in Table 5.

References

    1. Garcia de Leaniz C, Fleming IA, Einum S, Verspoor E, Jordan WC, et al. (2007) A critical review of adaptive genetic variation in Atlantic salmon: implications for conservation. Biological Reviews 82: 173–211. - PubMed
    1. Taylor EB (1991) A review of local adaptation in salmonidae, with particular reference to Pacific and Atlantic salmon. Aquaculture 98: 185–207.
    1. Fraser DJ, Weir LK, Bernatchez L, Hansen MM, Taylor EB (2011) Extent and scale of local adaptation in salmonid fishes: review and meta-analysis. Heredity 106: 404–420. - PMC - PubMed
    1. Stabell OB (1984) Homing and olfaction in salmonids - a critical review with special reference to the Atlantic salmon. Biological Reviews of the Cambridge Philosophical Society 59: 333–388.
    1. Ståhl G (1987) Genetic population strcuture of Atlantic salmon. In: Ryman N, Utter F, editors. Population genetics and fishery management: University of Washington press, Seattle. 121–140.

Publication types