. 2012;7(8):e43660.
doi: 10.1371/journal.pone.0043660. Epub 2012 Aug 20.

S-nitrosoglutathione acts as a small molecule modulator of human fibrin clot architecture

Affiliations

S-nitrosoglutathione acts as a small molecule modulator of human fibrin clot architecture

Ryon M Bateman et al. PLoS One. 2012.

Abstract

Background: Altered fibrin clot architecture is increasingly associated with cardiovascular diseases; yet, little is known about how fibrin networks are affected by small molecules that alter fibrinogen structure. Based on previous evidence that S-nitrosoglutathione (GSNO) alters fibrinogen secondary structure and fibrin polymerization kinetics, we hypothesized that GSNO would alter fibrin microstructure.

Methodology/principal findings: Accordingly, we treated human platelet-poor plasma with GSNO (0.01-3.75 mM) and imaged thrombin induced fibrin networks using multiphoton microscopy. Using custom designed computer software, we analyzed fibrin microstructure for changes in structural features including fiber density, diameter, branch point density, crossing fibers and void area. We report for the first time that GSNO dose-dependently decreased fibrin density until complete network inhibition was achieved. At low dose GSNO, fiber diameter increased 25%, maintaining clot void volume at approximately 70%. However, at high dose GSNO, abnormal irregularly shaped fibrin clusters with high fluorescence intensity cores were detected and clot void volume increased dramatically. Notwithstanding fibrin clusters, the clot remained stable, as fiber branching was insensitive to GSNO and there was no evidence of fiber motion within the network. Moreover, at the highest GSNO dose tested, we observed for the first time, that GSNO induced formation of fibrin agglomerates.

Conclusions/significance: Taken together, low dose GSNO modulated fibrin microstructure generating coarse fibrin networks with thicker fibers; however, higher doses of GSNO induced abnormal fibrin structures and fibrin agglomerates. Since GSNO maintained clot void volume, while altering fiber diameter it suggests that GSNO may modulate the remodeling or inhibition of fibrin networks over an optimal concentration range.


Conflict of interest statement

Competing Interests: The authors have declared that no competing interests exist.

Figures

Figure 1
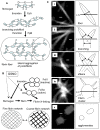
Figure 1. Fibrin polymerization, GSNO targets and fibrin structural elements imaged by multiphoton microscopy.
Panel A shows a schematic of fiber formation. Fibrinogen is a bisymmetrical molecule consisting of three pairs of polypeptide chains (Aα, Bβ, γ)2 held together by 29 disulfide bonds. It has a trinodal structure, with central E domain containing N-terminal regions of all six chains connected, by two coiled coils, to two end D domains containing the carboxy-terminal ends of the Bβ and γ chains. The carboxy-terminal portion of the Aα chain folds back from the D domain towards the E domain , , . Thrombin catalyzes the conversion of fibrinogen to fibrin by cleaving fibrinopeptides A,B from the central E domain. Fibrin monomers self assemble, via complementary E and D domain interactions, forming double stranded half-staggered protofibrils, that branch, elongate, and laterally associate, via released C-terminal α-domains, to form fibrin fibers that constitute the fibrin network , . S-nitrosglutathione (GSNO), a low molecular weight endogenous s-nitrosothiol present in blood, targets both fibrinogen altering its secondary structure and the exposed thiol group (R-SH) on factor XIIIa which stabilizes fibrin networks by cross-linking fibrin, panel B. GSNO has no effect on thrombin activity . (solid arrows indicate thrombin targets, while dashed lines indicate GSNO targets.) Clotting conditions control fibrin clot architecture between extreme forms of a fine (thin) fiber and dense network or a thick fiber and coarse (sparse) network, panel B . Panel C shows multiphoton images of fibrin network structural elements, including fibrin fibers (i), fiber branch junctions (ii), crossing fibers (iii), fibrin clusters (iv) and fibrin agglomerates (v). Fibrinogen schematic adapted from Undas et al. Scale bars are 700 nm.
Figure 2
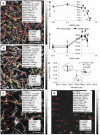
Figure 2. GSNO alters human fibrin fiber density and fiber diameter.
Platelet-poor plasma was incubated with GSNO as described in methods. Images of native fibrin clots were acquired using multiphoton microscopy and analyzed using custom designed computer software. Panels A,B,C,G show fibrin clot “read out” images at 0,1,2.5,3.75 mM GSNO, respectively. GSNO decreased fibrin fiber density, panel D, but increased fiber diameter to a maximum at 1 mM GSNO, panel E. Panel F plots fibrin density against fiber diameter. Panel C contained abnormal fibrin clusters with numerous thin diameter fibers protruding from a high intensity core. They decreased the average fiber diameter and shifted the expected density-diameter relationship panel F, point C (2.5 mM GSNO). Fibrin agglomerates were detected at the highest GSNO concentration tested, panel G. Fibrin clot parameters displayed on clot “read out” images: n (number of fibers), fiber density (fibers/100 um), fiber intensity (au, mean and CV), fiber diameter (nm, mean or median and CV), fiber thin-thick ratio vs control (diam-TTR (ctrl)), void area (%), crossing fibers (xfibers/fiber), trifunctional junctions (xbranching/fiber), fibrinogen clusters (FbgClusters/mm2) and fibrin agglomerates (AG/mm2). *p<0.05 vs control. Area is 59×59 um2. Colour bars are image intensity. Scale bars are 8.5 um.
Figure 3
Figure 3. GSNO increases human fibrin clot void volume.
Human fibrin clots were prepared and imaged as described in methods. 2D multiphoton images contain spatial information that can be used to quantify clot void volume and projected clot void area from a stack of three images. The calculation uses binary images of clots acquired at 40,50,60 microns above the clot surface, where white pixels are fibers and black pixels are empty space. Panel A shows 3 image stacks for control (C1,C2,C3) and 2.5 mM GSNO (B1,B2,B3), resulting in projected image C and B, respectively. Both clot void volume and projected clot area were insensitive to GSNO at low concentrations, but increased once GSNO exceeded 1.7 mM, panel D. At 3.75 mM GSNO, only fibrin agglomerates were present in plasma, rendering clot void volume effectively 100%, panel D. *p<0.05, compared to control.Scale bars are 8.5 um.
Figure 4
Figure 4. GSNO reduces fibrin branchpoint density, but does not alter the fiber density/branchpoint ratio.
Images of human fibrin clots in their native state were acquired using multiphoton microscopy and analyzed using custom designed computer software, as described in methods. Panels A,B,C show a multiphoton image with three branch points (B1,B2,B3) and their corresponding contour map and surface plots, respectively. Branch points are readily identifiable in surface plots, where three fibers intersect at the branch junction and the width of one fiber is approximately equal to the sum of the other fibers (F1 = F2+F3). As GSNO concentration increased, branch junctions per area decreased, panel D. However, the ratio of fiber density to branch point density was insensitive to GSNO concentration, panel E. *p<0.05, compared to control. Area is 59×59 um2. Colour bars are image intensity. Scale bar is 4.25 um.
Figure 5
Figure 5. Crossing fibers are more sensitive than fiber density to GSNO.
Images of native human fibrin clots were acquired using multiphoton microscopy and analyzed using custom designed computer software, as described in methods. Panels A,B,E,F show surface plots of fibrin fibers observed in the corresponding multiphoton image and contour figure, panels C,D respectively. Arrows connect the regions of interest. When two fibers cross at a point in space, there is a >40+/−15% increase in fluorescence intensity at the point of contact, that is proportional to fiber intensity. Panel A shows a trifunctional junction (F1 = F2+F3), panel B shows one fiber (F2) passing beneath another (F1), panel E shows two fibers (F1 and F2) crossing and panel F shows six fiber segments (or possibly three fibers) crossing at a point. As GSNO concentration increased, crossing fibers per area decreased, panel G. The ratio of fiber density to crossing fibers increased with increasing GSNO concentration, indicating the decrease in crossing fibers was greater than the decrease in fiber density, panel H. *p<0.05, compared to control. Area is 59×59 um2. Colour bars are image intensity. Scale bars are 700 nm.
Figure 6
Figure 6. High concentrations of GSNO induced formation of abnormal fibrin clusters and fibrin agglomerates.
Human fibrin clots were prepared and imaged as described in methods. When platelet-poor plasma was incubated with 2.5 mM GSNO, image analysis revealed the presence of abnormal fibrin clusters, characterized by high intensity cores with numerous protruding fibers, panels A and B. An unexpected finding was that 3.75 mM GSNO resulted in the formation of fibrin agglomerates, panel C. Panel D is a histogram of agglomerate long axis diameter. A projected binary image from 30,50,70 microns within the plasma sample, revealed the heterogeneous nature of the agglomerates, panel E. See data supplement figure 3 for additional images of agglomerates. Based on the GSNO dose-response curves, panel F, fibrin cluster formation preceded fibrin agglomerate formation. *p<0.05, compared to control. Scale bars for panels A,E are 8.5 um. Scale bars for panels B,C are 4.25 um.

References

    1. Collet JP, Allali Y, Lesty C, Tanguy ML, Silvain J, et al. (2006) Altered fibrin architecture is associated with hypofibrinolysis and premature coronary atherothrombosis. Arterioscler Thromb Vasc Biol 26: 2567–2573. - PubMed
    1. Mills JD, Ariens RA, Mansfield MW, Grant PJ (2002) Altered fibrin clot structure in the healthy relatives of patients with premature coronary artery disease. Circulation 106: 1938–1942. - PubMed
    1. Scott DJ, Prasad P, Philippou H, Rashid ST, Sohrabi S, et al. (2011) Clot architecture is altered in abdominal aortic aneurysms and correlates with aneurysm size. Arterioscler Thromb Vasc Biol 31: 3004–3010. - PubMed
    1. Undas A, Podolec P, Zawilska K, Pieculewicz M, Jedlinski I, et al. (2009) Altered fibrin clot structure/function in patients with cryptogenic ischemic stroke. Stroke 40: 1499–1501. - PubMed
    1. Vadseth C, Souza JM, Thomson L, Seagraves A, Nagaswami C, et al. (2004) Pro-thrombotic state induced by post-translational modification of fibrinogen by reactive nitrogen species. J Biol Chem 279: 8820–8826. - PubMed

Publication types