. 2012;7(8):e43712.
doi: 10.1371/journal.pone.0043712. Epub 2012 Aug 20.

Vacuolar protein sorting receptor in Giardia lamblia

Affiliations

Vacuolar protein sorting receptor in Giardia lamblia

Maria R Rivero et al. PLoS One. 2012.

Abstract

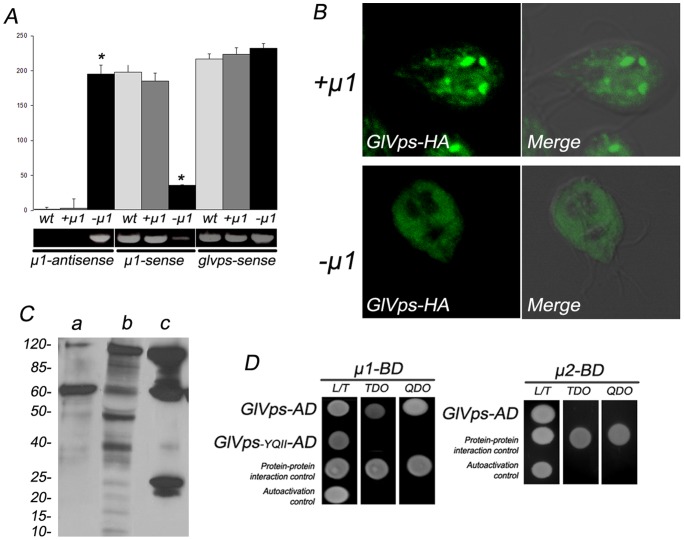
In Giardia, lysosome-like peripheral vacuoles (PVs) need to specifically coordinate their endosomal and lysosomal functions to be able to successfully perform endocytosis, protein degradation and protein delivery, but how cargo, ligands and molecular components generate specific routes to the PVs remains poorly understood. Recently, we found that delivering membrane Cathepsin C and the soluble acid phosphatase (AcPh) to the PVs is adaptin (AP1)-dependent. However, the receptor that links AcPh and AP1 was never described. We have studied protein-binding to AcPh by using H6-tagged AcPh, and found that a membrane protein interacted with AcPh. This protein, named GlVps (for Giardia lamblia Vacuolar protein sorting), mainly localized to the ER-nuclear envelope and in some PVs, probably functioning as the sorting receptor for AcPh. The tyrosine-binding motif found in the C-terminal cytoplasmic tail domain of GlVps was essential for its exit from the endoplasmic reticulum and transport to the vacuoles, with this motif being necessary for the interaction with the medium subunit of AP1. Thus, the mechanism by which soluble proteins, such as AcPh, reach the peripheral vacuoles in Giardia appears to be very similar to the mechanism of lysosomal protein-sorting in more evolved eukaryotic cells.


Conflict of interest statement

Competing Interests: The authors have declared that no competing interests exist.

Figures

Figure 1
Figure 1. AcPh localization and activity.
(A) Schematic representation of the acph gene containing the GGTAAGCCTATCCCTAACCCTCTCCTCGGTCTCGATTCTACGCGTA. CCGGT and CATCATCATCATCATCAT, coding to the V5 epitope and six histidine residues, respectively. A 3D reconstruction of the gene product tagged with V5-H6 using the hidden Markov models (HMMs) and MODELLER is also represented. (B) IFA and confocal microscopy show AcPh-V5 predominantly in the ER but also in the nuclear envelope and PVs (arrowheads). DIC: Differential interference contrast microscopy. (C) Acid phosphatase activity on the PVs and bare zone is observed by using the specific substrate ELF97 at pH 5.5. Alkaline phosphatase activity was not detected in trophozoites at pH ≥7.0. Nuclear DNA was labeled with 4′,6-diamidino-2-phenylindole (DAPI) (blue). Bar, 10 μm.
Figure 2
Figure 2. AcPh-V5H6 pulled-down associated proteins.
(A) SDS-PAGE stained with Coomassie blue for total protein shows AcPh-V5H6-binding proteins from transgenic trophozoite extracts identified by affinity chromatography and mass spectrometry. PD1-3 are independent pull-down assays. The proteins identified are shown as: a: not determined; b: kinesin-like protein (GL50803_14070, GL50803_17264); c: Vacuolar protein sorting 35 (GL50803_23833); d: unknown protein (GL50803_28954). Asterisks (*) denote detection of AcPh. Control lane (Ctrol) shows no protein binding when wild-type trophozoites were used. (B) Immunoblotting shows the presence of AcPh-V5H6 in PD1-3 but not in control. Asterisks (*) denote detection of AcPh-V5H6 by using anti-V5 mAb. Molecular weights of protein standards (SD) in kDa are shown on the left.
Figure 3
Figure 3. Expression of GL28954.
(A) RT-PCR experiment show that the mRNA of GL28954 is expressed as predicted by the GiardiaDB. 1: fragment of 1490 bp amplified using the primer pair F2/R1; 2: the predicted 1653 bp ORF amplified using the primer pair F1/R1; 3: expression of a gdh mRNA fragment was tested as positive control; 4: DNA-contamination control. (B) Immunoblotting using anti-HA mAb shows the predicted band of 60 kDa for GL28954 (black arrow) but also a higher 120 kDa band that might correspond to GL28954 homodimer (gray arrow) in transgenic trophozoites (TT). Wild-type trophozoites (WT) do not show the presence of GL28954-HA. Relative molecular weights of protein standards (kDa) are indicated on the left. (C) IFA and confocal microscopy show the HA-tagged GL28954 mainly around the nuclei. DIC: Differential interference contrast microscopy. Nuclear DNA was labeled with DAPI (blue). Bar, 10 μm.
Figure 4
Figure 4. The Giardia lamblia Vacuolar protein sorting (GlVps) topology analysis suggests an Nlumenal/Ccytoplasmic localization.
(A) Schematic representation of GlVps. The presence of a transmembrane domain (in black) flanked by the TM-stop residues (R543, D523, and D526) is shown. The unlikely hydrophobic motif H1 (residues 143 to 167) is also depicted in dotted bar. One WD40 protein-binding domain (3D structure) between the residues 240–482 at the N-terminus (in gray) and the cytoplasmic tail (in white) containing the YQII lysosomal motif are shown in the diagram. (B) GlVps-ha transgenic cells were grown and lysed under hypotonic conditions. Supernatant (SN) and pellet (P) fractions were recovered, concentrated to normalize loading and analyzed by immunoblotting. GlVps-HA and VSP1267 are restricted to the membrane-bound population in the pellet (upper and middle panel). The cytosolic GlENTH-HA protein (Feliziani and Touz, unpublished results) is mainly present in the cytosolic fraction. W: soluble proteins after washing. Anti-HA mAb was used for GlVps-HA and GlENTH-HA and 5C1 mAb for VSP1267. (C) Immunoblotting after proteinase K (PK) assay shows the protection of BiP but not GlVps-HA after membrane permeabilization by digitonin (Dig+PK). Permeabilization with Triton X-100 previous to PK treatment shows both BiP and GlVps-HA degradation (Tx100+PK). Permeabilization with Triton X-100 without PK addition shows the presence of both proteins (Tx100). In these assays, wild-type trophozoites not expressing GLVps-HA and GlVps-HA transgenic cells were used. Relative molecular weights of protein standards (kDa) are indicated on the left. (D) IFA and epifluorescence microscopy after 50 µg PK assay confirms that the C-terminal portion of GlVps is unprotected from protease, revealing the cytoplasmic orientation of its C-terminus (digitonin+PK, top panel). Conversely, the lumenal ER-protein BiP was not processed by the PK (digitonin+PK, bottom panel) and was detected in the ER. Degradation of BiP and GlVps-HA was observed in the control of cells permeabilized with Triton X-100 previous PK treatment (Tx100+PK) but not in the control, where the cells were treated with Triton X-100 or digitonin without PK addition (Tx100 – digitonin). Anti-BiP or anti-HA mAb were used in the assay shown in (B) and (C) to detect BiP or GlVps, respectively. GlVps-HA transgenic cells were used in this experiment. Individual images were processed in the same way. Nuclear DNA was labeled with 4′,6-diamidino-2-phenylindole (DAPI) (blue). Bar, 10 μm.
Figure 5
Figure 5. Subcellular distribution of GlVps.
(A) Direct IFA and confocal microscopy show that GlVps-HA (green) partially colocalizes with the ER-resident chaperone BiP (red) in the ER (Merge in yellow). Inset magnifies a region of the cell and shows the green and red fluorescence in the ER (a). Differential interference contrast microscopy (b) is shown as insert. Scatter plot of the two labels confirms the colocalization (right panel). (B) Direct IFA and confocal microscopy using the 2F5 mAb that detect the μ2 subunit of AP2 in the PVs (red) and anti-HA mAb to detect GlVps-HA (green), show the presence of GlVps-HA in some PVs. Inset magnifies a region of the cell where the green and red fluorescence partially overlap (a). Differential interference contrast microscopy (b) is shown as insert. Bar, 10 μm. Scatter plot (panel on the right) correspond to the colocalization analysis. Pearson's coefficient (PC). Manders' Overlap coefficient (M).
Figure 6
Figure 6. The YQII motif of GlVps contributes to receptor stabilization.
(A) GlVps-YQII–HA (green) is observed in the cytosol (cyt) of trophozoites probable in small vesicles (white arrows in insert) by IFA and confocal microscopy. pm: plasma membrane. (B) GlVps-YQII–HA (green) do not colocalizes with BiP (red) in the ER (Merge). Inset (a) magnifies a region of the cell and shows that the green and red fluorescence are well separated. Differential interference contrast microscopy (b) is shown as insert. Scatter plot (panel on the left) correspond to the colocalization analysis. (C) Partial colocalization of GlVps-YQII–HA (green) and μ2 (red) is observed in the PV region (Merge). Inset (a) magnifies a region of the cell where the green and red fluorescence partially overlap in the PVs. Differential interference contrast microscopy (b) is shown as insert. Bars, 10 μm. Scatter plot of the two labels shows the colocalization (left panel). Pearson's coefficient (PC). Manders' Overlap coefficient (M). (D) GlVps-HA and GlVps-YQII–HA are detected by immunoblotting using anti-HA mAb in GlVps-ha, GlVps-YQII–ha trophozoites, respectively. No detection of these receptors was observed in wild-type cells. Proteolytic processing is observed for GlVps-YQII–HA in comparison with GlVps–HA. Relative molecular weights of protein standards (kDa) are indicated on the left.
Figure 7
Figure 7. GlVps and the medium subunit of AP1 interact via the YQII motif.
(A) Densitometric assessment of one representative RT–PCR experiment shown on bottom. The amount of 1000 nt antisense RNA from the vector is only observed in −µ1 trophozoites. Reduction of endogenous μ1 mRNA levels is observed in −µ1, but not in +µ1 or wild-type cells (wt). Similar expression of glvps mRNA in wild-type, +µ1 and −µ1 cells was observed. (*p<0,0001). (B) GlVps-HA is observed in the cytoplasm in µ1-depleted cells. In cell expressing µ1 (+µ1), GlVps-HA possesses a reticular-perinuclear distribution. Merge panels of green fluorescence and differential interference contrast microscopy for +µ1 and −µ1 trophozoites are shown. Bar, 10 μm. (C) GlVps-HA is detected by immunoblotting using anti-HA mAb in +µ1 (a) and −µ1 (b) trophozoites. The proteolytic processing of GlVps-HA observed in −µ1 trophozoites, differs from the processing of GlVPS-YQII-HA in cells expressing µ1 (c). Relative molecular weights of protein standards (kDa) are indicated on the left. (D) The yeast two-hybrid assay demonstrates that GlVps (GlVps-AD) but not GlVps-YQII (GlVps-AD lacking the lysosomal motif) interacts with μ1 (μ1-BD) (left panel). GlVps (GlVps-AD) does not interact with the μ2 subunit of AP2 (μ2-BD) (right panel). Interaction is noticed by the growth of yeast colonies in plates lacking tryptophan, leucine and histidine [TDO (triple-dropout medium) plates] and in the high-stringency medium that also lacked adenine (QDO). Controls of the methodology include testing of pESCP-AD/pµ1-BD or pGlLRP-AD/pµ2-BD (protein-protein interaction) and pGlVps-AD/pGBKT7 (autoactivation).
Figure 8
Figure 8. GlVps and AcPh colocalized throughout the lysosomal pathway.
(A) Direct IFA and confocal microscopy show the colocalization (Merge) of GlVps (green) and AcPh-V5H6 (red) using directed labeled anti-HA and anti-V5, respectively. Inset magnifies a region of the cell and shows colocalization of the green and red fluorescence in yellow (a). Differential interference contrast microscopy (b) is shown as insert. Scatter plot of the two labels confirms the colocalization (right panel). Bar, 10 μm. (B) AcPh/GlVps and AcPh/GlVps-YQII interaction was detected by the ability of yeast cells (AH109) to grow on selective plates TDO. No interaction was observed in the high-stringency QDO medium. Controls of the methodology include testing of pESCP-AD/pµ1-BD (protein-protein interaction) and pGlVps-AD/pGBKT7 (autoactivation).
Figure 9
Figure 9. GlVps depletion affects AcPh localization and activity.
(A) Bars indicate densitometric assessment of one representative RT-PCR experiment using 10 ng of total RNA from GlVps-antisense (AS) and empty (Ctrol) transgenic trophozoites. The densitometric analysis shows the production of glvps-antisense RNA in AS trophozoites but not in Ctrol cells. On the contrary, the glvps transcripts are highly reduced only in AS cells. acph mRNA was not altered in these cells. All transcripts were normalized against gdh endogenous control before graphic construction. Results are the means ± S.D. of three independent experiments (*p<0,0001). (B) By using the specific substrate ELF97 at pH 5.5, a notably reduction of acid phosphatase activity is observed in GlVps-antisense (AS) compared with empty (Ctrol) transgenic trophozoites. Nuclear DNA was labeled with DAPI (blue). One representative picture is shown. Bar, 10 μm. The graph on the left shows the quantitative fluorescent measurements of ELF97 (acid phosphatase activity). A significant decrease in mean fluorescence in AS cells is observed when compared with Ctrol cells (*p<0,0001). The mean fluorescence of all the acidic vesicles was calculated within each cell. Results are the means ± S.D. of 100 independent cells/group. (C) Crude protein extract from equal numbers of GlVps-antisense+AcPh-V5 transgenic and wild-type (wt) trophozoites was separated by SDS–PAGE and analyzed by immunoblotting using anti-V5 mAb. Relative molecular weights of protein standards (kDa) are indicated on the left. (D) AcPh-V5 is mislocalized in GlVps-antisense+AcPh-V5 (AS) transgenic trophozoites compared with control AcPh-V5 transgenic trophozoites (Ctrol).

References

    1. Rodriguez-Boulan E, Musch A (2005) Protein sorting in the Golgi complex: shifting paradigms. Biochim Biophys Acta 1744: 455–464. - PubMed
    1. Braulke T, Bonifacino JS (2009) Sorting of lysosomal proteins. Biochim Biophys Acta 1793: 605–614. - PubMed
    1. Marcusson EG, Horazdovsky BF, Cereghino JL, Gharakhanian E, Emr SD (1994) The sorting receptor for yeast vacuolar carboxypeptidase Y is encoded by the VPS10 gene. Cell 77: 579–586. - PubMed
    1. Winther JR, Stevens TH, Kielland-Brandt MC (1991) Yeast carboxypeptidase Y requires glycosylation for efficient intracellular transport, but not for vacuolar sorting, in vivo stability, or activity. Eur J Biochem 197: 681–689. - PubMed
    1. Jorgensen MU, Emr SD, Winther JR (1999) Ligand recognition and domain structure of Vps10p, a vacuolar protein sorting receptor in Saccharomyces cerevisiae. Eur J Biochem 260: 461–469. - PubMed

Publication types