

Dopamine synthesis and D3 receptor activation in pancreatic β-cells regulates insulin secretion and intracellular [Ca(2+)] oscillations
- PMID: 22918877
- PMCID: PMC3487623
- DOI: 10.1210/me.2012-1226
Dopamine synthesis and D3 receptor activation in pancreatic β-cells regulates insulin secretion and intracellular [Ca(2+)] oscillations
Abstract
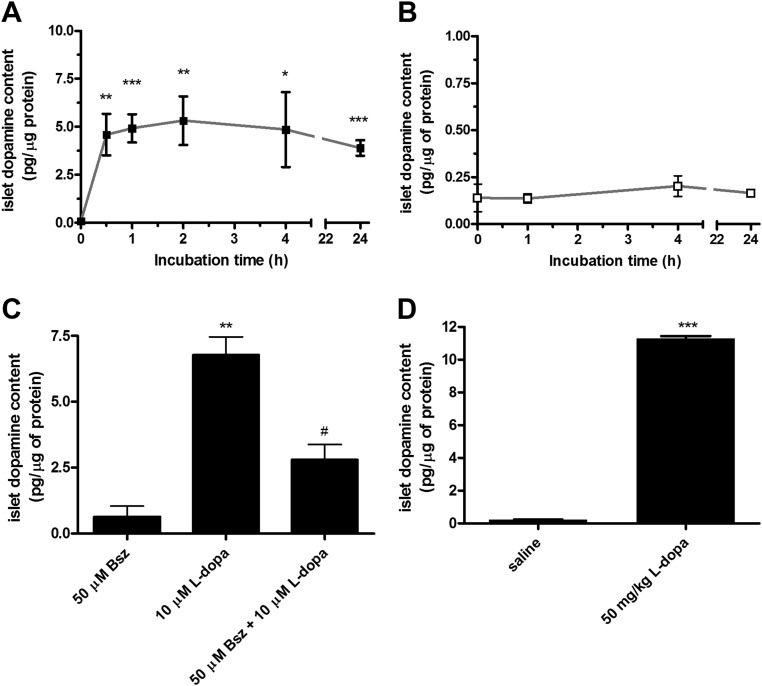
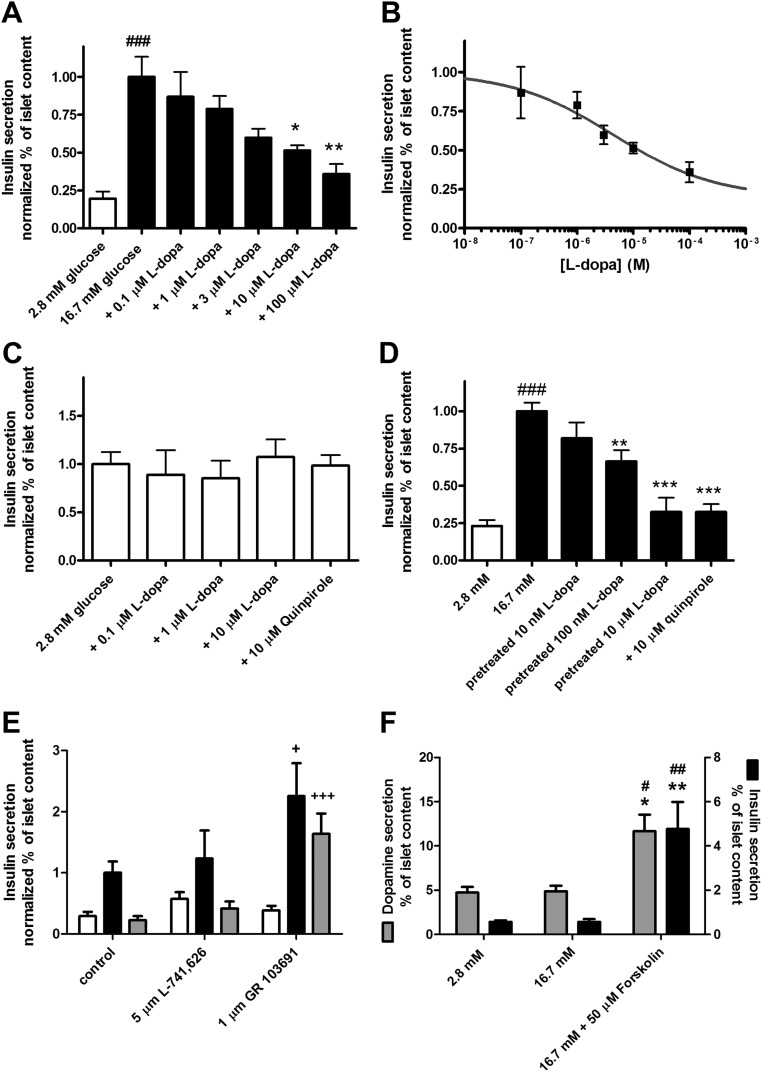
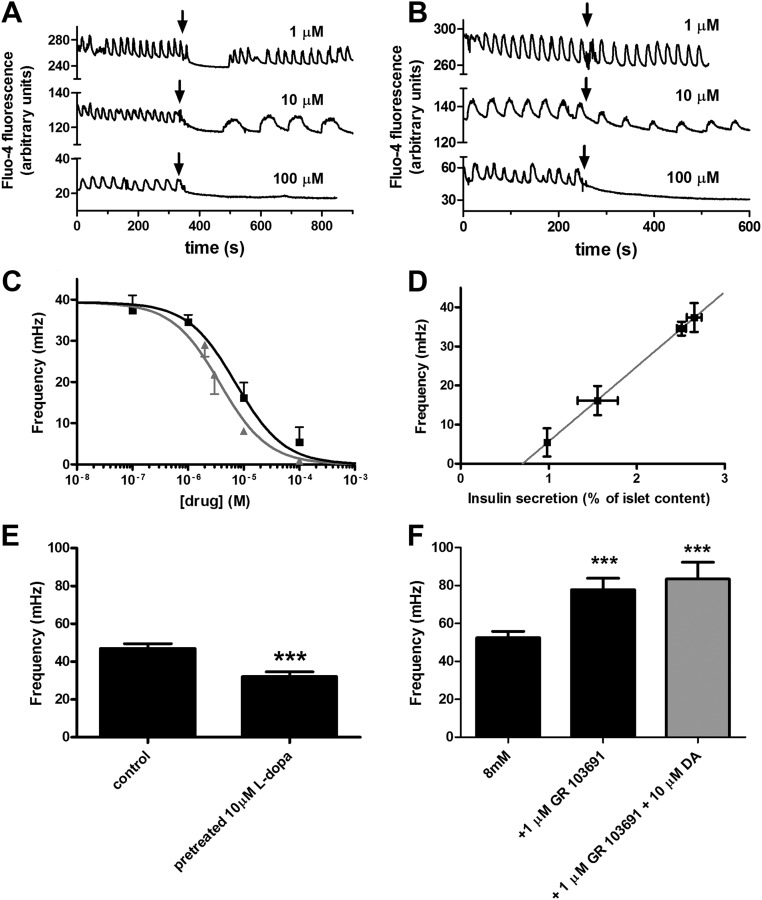
Pancreatic islets are critical for glucose homeostasis via the regulated secretion of insulin and other hormones. We propose a novel mechanism that regulates insulin secretion from β-cells within mouse pancreatic islets: a dopaminergic negative feedback acting on insulin secretion. We show that islets are a site of dopamine synthesis and accumulation outside the central nervous system. We show that both dopamine and its precursor l-dopa inhibit glucose-stimulated insulin secretion, and this inhibition correlates with a reduction in frequency of the intracellular [Ca(2+)] oscillations. We further show that the effects of dopamine are abolished by a specific antagonist of the dopamine receptor D3. Because the dopamine transporter and dopamine receptors are expressed in the islets, we propose that cosecretion of dopamine with insulin activates receptors on the β-cell surface. D3 receptor activation results in changes in intracellular [Ca(2+)] dynamics, which, in turn, lead to lowered insulin secretion. Because blocking dopaminergic negative feedback increases insulin secretion, expanding the knowledge of this pathway in β-cells might offer a potential new target for the treatment of type 2 diabetes.
Figures
Similar articles
-
Glutaredoxin-1 mediates NADPH-dependent stimulation of calcium-dependent insulin secretion.Mol Endocrinol. 2009 Jun;23(6):893-900. doi: 10.1210/me.2008-0306. Epub 2009 Mar 19. Mol Endocrinol. 2009. PMID: 19299446 Free PMC article.
-
Effects of CaMKII-mediated phosphorylation of ryanodine receptor type 2 on islet calcium handling, insulin secretion, and glucose tolerance.PLoS One. 2013;8(3):e58655. doi: 10.1371/journal.pone.0058655. Epub 2013 Mar 13. PLoS One. 2013. PMID: 23516528 Free PMC article.
-
Control of the intracellular redox state by glucose participates in the insulin secretion mechanism.PLoS One. 2011;6(8):e24507. doi: 10.1371/journal.pone.0024507. Epub 2011 Aug 31. PLoS One. 2011. PMID: 21909396 Free PMC article.
-
Minireview: Dopaminergic regulation of insulin secretion from the pancreatic islet.Mol Endocrinol. 2013 Aug;27(8):1198-207. doi: 10.1210/me.2013-1083. Epub 2013 Jun 6. Mol Endocrinol. 2013. PMID: 23744894 Free PMC article. Review.
-
The triggering pathway to insulin secretion: Functional similarities and differences between the human and the mouse β cells and their translational relevance.Islets. 2017 Nov 2;9(6):109-139. doi: 10.1080/19382014.2017.1342022. Epub 2017 Jun 29. Islets. 2017. PMID: 28662366 Free PMC article. Review.
Cited by
-
Network Systems Pharmacology-Based Mechanism Study on the Beneficial Effects of Vitamin D against Psychosis in Alzheimer's Disease.Sci Rep. 2020 Apr 9;10(1):6136. doi: 10.1038/s41598-020-63021-8. Sci Rep. 2020. PMID: 32273551 Free PMC article.
-
Neuronal Dopamine D3 Receptors: Translational Implications for Preclinical Research and CNS Disorders.Biomolecules. 2021 Jan 14;11(1):104. doi: 10.3390/biom11010104. Biomolecules. 2021. PMID: 33466844 Free PMC article. Review.
-
Parkinson's disease and glucose metabolism impairment.Transl Neurodegener. 2025 Feb 17;14(1):10. doi: 10.1186/s40035-025-00467-8. Transl Neurodegener. 2025. PMID: 39962629 Free PMC article. Review.
-
Vascular endothelial growth factor coordinates islet innervation via vascular scaffolding.Development. 2014 Apr;141(7):1480-91. doi: 10.1242/dev.098657. Epub 2014 Feb 26. Development. 2014. PMID: 24574008 Free PMC article.
-
Tyrosine hydroxylase conditional KO mice reveal peripheral tissue-dependent differences in dopamine biosynthetic pathways.J Biol Chem. 2021 Jan-Jun;296:100544. doi: 10.1016/j.jbc.2021.100544. Epub 2021 Mar 15. J Biol Chem. 2021. PMID: 33737022 Free PMC article.
References
-
- Leahy JL. 2005. Pathogenesis of type 2 diabetes mellitus. Arch Med Res 36:197–209 - PubMed
-
- Leahy JL, Hirsch IB, Peterson KA, Schneider D. 2010. Targeting β-cell function early in the course of therapy for type 2 diabetes mellitus. J Clin Endocrinol Metab 95:4206–4216 - PubMed
-
- Brissova M, Fowler MJ, Nicholson WE, Chu A, Hirshberg B, Harlan DM, Powers AC. 2005. Assessment of human pancreatic islet architecture and composition by laser scanning confocal microscopy. J Histochem Cytochem 53:1087–1097 - PubMed
Publication types
MeSH terms
Substances
Grants and funding
LinkOut - more resources
Full Text Sources
Medical
Miscellaneous
