. 2012 Oct;23(20):4079-96.
doi: 10.1091/mbc.E12-04-0299. Epub 2012 Aug 23.

Nucleolar accumulation of APE1 depends on charged lysine residues that undergo acetylation upon genotoxic stress and modulate its BER activity in cells

Affiliations

Nucleolar accumulation of APE1 depends on charged lysine residues that undergo acetylation upon genotoxic stress and modulate its BER activity in cells

Lisa Lirussi et al. Mol Biol Cell. 2012 Oct.

Abstract

Apurinic/apyrimidinic endonuclease 1 (APE1) is the main abasic endonuclease in the base excision repair (BER) pathway of DNA lesions caused by oxidation/alkylation in mammalian cells; within nucleoli it interacts with nucleophosmin and rRNA through N-terminal Lys residues, some of which (K(27)/K(31)/K(32)/K(35)) may undergo acetylation in vivo. Here we study the functional role of these modifications during genotoxic damage and their in vivo relevance. We demonstrate that cells expressing a specific K-to-A multiple mutant are APE1 nucleolar deficient and are more resistant to genotoxic treatment than those expressing the wild type, although they show impaired proliferation. Of interest, we find that genotoxic treatment induces acetylation at these K residues. We also find that the charged status of K(27)/K(31)/K(32)/K(35) modulates acetylation at K(6)/K(7) residues that are known to be involved in the coordination of BER activity through a mechanism regulated by the sirtuin 1 deacetylase. Of note, structural studies show that acetylation at K(27)/K(31)/K(32)/K(35) may account for local conformational changes on APE1 protein structure. These results highlight the emerging role of acetylation of critical Lys residues in regulating APE1 functions. They also suggest the existence of cross-talk between different Lys residues of APE1 occurring upon genotoxic damage, which may modulate APE1 subnuclear distribution and enzymatic activity in vivo.


Figures
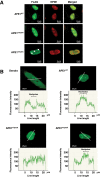
FIGURE 1:
FIGURE 1:
Positively charged K27/K31/K32/K35 residues are required for APE1 nucleolar accumulation. (A) Confocal microscopy of HeLa cells transfected with APE1WT, APE1K4pleA, or APE1K4pleR FLAG-tagged proteins and stained with antibodies against NPM1 (red) and ectopic FLAG-APE1 (green). Overlap of staining (yellow) demonstrated colocalization of the two proteins. Of note, the APE1K4pleA mutant was completely excluded from nucleoli (white arrowheads), whereas both APE1WT and the APE1K4pleR were accumulated within. Images are representative of 100% of transfected cells. (B) HeLa cells transfected with pDendra2-N empty vector or encoding APE1 (wild-type and mutants) in fusion with Dendra fluorophore were analyzed with a live confocal microscopy workstation. Cells transfected with empty vector (Dendra) showed diffuse green fluorescence within cytoplasm and nucleus, with exclusion of the nucleolar compartment. APE1WT and APE1K4pleR mutant mainly localized within the nuclear compartment and accumulated within nucleoli. In contrast, APE1K4pleA did not show any nucleolar accumulation. Images were captured by using the same settings (488-nm laser at 10% of intensity and PMT at 760 V). Fluorescence intensity analysis was carried out on a 25-μm-long line (white). Graphs represent the fluorescence intensity measured through a cross section of the nucleus and demonstrate an incremental fluorescence in corresponding nucleoli only in the case of APE1WT and APE1K4pleR-Dendra fusion protein–expressing cells.
FIGURE 2:
FIGURE 2:
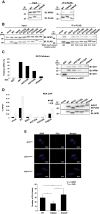
Positively charged K27/K31/K32/K35 residues are required for NPM1 interaction. (A) The APE1K4pleA mutant shows impaired interaction with NPM1. Coimmunoprecipitation (CoIP) analysis on HeLa cells transfected with APE1WT, APE1K4pleA, or APE1K4pleR FLAG-tagged proteins with endogenous NPM1. Western blot analysis was used to quantify the interaction among the different APE1 forms and NPM1 by using specific antibodies. IB, immunoblot. (B) K27/K31/K32/K35 residues are responsible for proper interaction of APE1 with NPM1. CoIP analysis on HeLa cells transfected with FLAG-tagged APE1WT, APE1NΔ33, or the APE1 double (APE1K27/35A, APE1K31/32A, APE1K27/35R, and APE1K31/32R) or quadruple (APE1K4pleA and APE1K4pleR) K-to-A or K-to-R mutants. Western blot analysis was performed on total cell extracts (left) and on immunoprecipitated material (right) with specific antibody for endogenous NPM1. Normalized coimmunoprecipitated amounts of NPM1 are indicated under each relative bar. Anti-FLAG staining was used as loading control. (C) Interaction of K-to-A APE1 mutants with NPM1 and rRNA. A 150-pmol amount of each bait GST-APE1 recombinant purified protein (rAPE1) was incubated with an equimolar amount of recombinant NPM1, as described in Materials and Methods. After GST pull-down, samples underwent Western blot analysis by using the indicated antibodies (right). NPM1 band intensities were normalized vs. those of GST-APE1 proteins, and the resulting values, expressed as percentage of bound with respect to APE1WT, were plotted in the histogram (left). Each bar represents the mean of two independent experiments whose variation was <10%. (D) Interaction of K-to-A APE1 mutants with NPM1 and rRNA. After transfection of HeLa cells, total cell lysates were prepared as described in Materials and Methods, and an RNA-ChIP assay was performed to measure the rRNA-binding activity of the different APE1 mutants. Immunoprecipitated samples underwent either Western blot analysis (right) or RNA extraction and quantification by reverse transcription and quantitative PCR analysis, using 18S and 47S rRNA–specific primers. Data are presented as a fold percentage of the amount of total 18S or 47S rRNA with respect to the amount of immunoprecipitated FLAG-tagged APE1 protein, respectively. The resulting values are plotted in the histograms (left), showing the average values with SD of three independent experiments. (E) Nucleoplasmic interaction between APE1 and NPM1 is affected by K-to-A mutation on APE1. PLA technology was used to evaluate in vivo the effect of positively charged K27/K31/K32/K35 residues on APE1 interaction with NPM1 in the nuclear compartment. Stable HeLa clones expressing APE1WT, APE1K4pleA, or APE1K4pleR FLAG-tagged proteins were seeded on a glass coverslip, and PLA reaction was carried out using anti-FLAG and anti-NPM1 antibodies. 4′,6-Diamidino-2-phenylindole staining is used as a reference for the nuclei. The histogram represents the average number of PLA blobs scored for at least 30 cells per slide. Asterisks represent a significant difference between APE1WT and mutants.
FIGURE 3:
FIGURE 3:
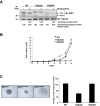
Expression of the nucleolus-deficient APE1 mutant causes impaired cell proliferation. (A) Generation of reconstituted cell lines expressing APE1K4pleA and APE1K4pleR mutants. HeLa cells were stably transfected with the inducible siRNA vectors and siRNA resistant APE1WT, APE1K4pleA, and APE1K4pleR–expressing vectors, as previously described (Vascotto et al., 2009a; Fantini et al., 2010). Expression of ectopic APE1 forms without silencing and after the suppression of endogenous APE1 expression after 10 d of treatment with doxycycline (Doxy) was assayed by Western blotting on total cellular extracts with an anti-APE1 antibody. Normalized expression levels for each clone of ectopic and endogenous APE1 protein after the silencing are indicated under each relative band. β-Tubulin was used as loading control. (B) Cell proliferation assays for APE1-reconstituted cell lines. APE1-expressing cell clones were seeded in 60-mm Petri dishes. Growth was followed by measuring cell numbers at various times upon doxycycline treatment, as indicated. Cells were harvested at the indicated times, stained with trypan blue, and counted in triplicate. Data, expressed as cell number, are the mean ± SD of three independent experiments. (C) Colony formation assays for APE1-reconstituted cell lines. After 8 d of doxycycline treatment, 200 cells of APE1WT and the indicated APE1 mutants were seeded in 60-mm Petri dishes and grown for 8 d in medium supplemented with doxycycline to promote endogenous APE1 silencing. Then cells were stained with crystal violet and images captured by using a Leica S8 microscope with 80× magnification. Data, expressed as number of cells per colony, are the mean ± SD of 10 colonies for each clone.
FIGURE 4:
FIGURE 4:
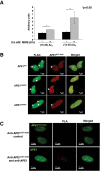
Genotoxic treatment promotes APE1 acetylation at K27/K31/K32/K35 residues. (A) Relative quantitative changes of APE1 acetylation at K27/K31/K32/K35 after MMS treatment. Mass spectrometry analysis of acetylated peptides present in the endoprotease AspN digest of FLAG-tagged APE1WT purified from HeLa cells (see Materials and Methods for details). Histograms indicate the relative amounts of the peptides (15–33)Ac3 and (15–35)Ac4 with respect to their nonmodified counterparts before and after MMS treatment. Identical ionization tendencies were assumed for each peptide pair. Each bar represents the mean of three independent experiments. (B) Acetylated APE1 at K27/K31/K32/K35 residues is present within cell nucleoplasm but is excluded from nucleoli. Confocal microscopy of HeLa cells transfected with APE1WT, APE1K4pleA, or APE1K4pleR FLAG-tagged proteins and stained with antibodies against endogenous APE1K27–35Ac (anti-APE1K27–35Ac, red) and ectopic APE1 FLAG-tagged (green). Overlap of staining (yellow) demonstrated the codetection of the two protein forms. Images are representative of 100% of transfected cells. (C) APE1 acetylation at K27/K31/K32/K35 occurs in vivo. PLA signal obtained using the anti-APE1K27–35Ac antibody together with the anti-APE1 antibody on fixed HeLa cells. A technical control, using the anti-APE1K27–35Ac antibody alone, was introduced (top). Nuclei were counterstained using an Alexa Fluor 488–conjugated secondary anti-rabbit (recognizing the endogenous APE1K27–35Ac, in the control reaction) or anti-mouse antibody (recognizing the endogenous APE1 protein in the PLA reaction; green).
FIGURE 5:
FIGURE 5:
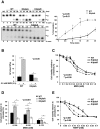
Abolition of positively charges K27/K31/K32/K35 residues increases APE1 DNA-repair activity. (A) Nuclear extracts from APE1K4pleA mutant present an increased AP endonuclease activity on abasic DNA. AP-site incision activity of the nuclear extracts from HeLa-reconstituted cell clones was tested using an AP endonuclease activity assay as described in Material and Methods. The nuclear APE1 content in each clone was precisely quantified through a titration curve obtained using purified recombinant APE1 (Supplemental Figure S4). Nuclear ectopic APE1 protein levels were then normalized between the different cell clones in order to compare their relative enzymatic activities. Top left, concentration-dependent conversion of an AP site–containing DNA substrate (S) to the incised product (P). A representative image of the denaturing polyacrylamide gel of the enzymatic reactions is shown. The amounts (femtomoles) of APE1 used in the reaction and the percentage of substrate converted into product, as determined by standard phosphorimager analysis, are indicated. NE, no cell extract control. Bottom left, time-dependent kinetics of APE1 (2.15 ng) endonuclease activity from nuclear extracts of the different reconstituted cell clones. The image of a representative gel analysis is shown (bottom). Right, graph depicting the time-course kinetics of APE1 from incision results shown on the left. Average values are plotted ± SD of three independent experiments. Asterisks represent a significant difference between APE1WT and APE1K4pleA. (B) Accumulation of genomic abasic (AP) lesions after MMS treatment (0.5 mM, 4 h) of reconstituted cell clones with APE1WT and APE1K4pleA mutant as measured by an aldehyde-reactive probe. APE1WT and APE1K4pleA-expressing HeLa cells were grown in medium supplemented with Doxy (10 d) to silence endogenous APE1 expression and were treated with 0.5 mM MMS for 4 h. Counting at the AP sites was performed by using the AP-site quantification kit, as described in Materials and Methods. In the histogram, data are expressed as number of AP sites per 105 base pairs and represent the mean ± SD of four independent experiments. Asterisks represent a significant difference between the two conditions (untreated and MMS-treated cells). (C) Effects of APE1 acetylation mutants on cell viability after MMS treatment in reconstituted cells. APE1WT, APE1K4pleA-, and APE1K4pleR-expressing cells were grown in medium supplemented with Doxy to silence APE1 endogenous protein and treated with increasing concentrations of MMS for 8 h; the cytotoxic effect of this compound was determined by the MTS assay (see Materials and Methods for details). Each point, shown as percentage viability with respect to untreated clones, represents the mean ± SD of four observations, repeated in at least two independent assays. Asterisks represent a significant difference between APE1K4pleA and APE1K4pleR mutants. (D) Cell growth as measured by colony survival assay. One thousand cells of APE1WT-, APE1K4pleA-, and APE1K4pleR-expressing clones treated with increasing concentrations of MMS for 8 h were seeded in Petri dishes and then treated with Doxy for 10 d to silence endogenous APE1. Data, expressed as the percentage of change with respect to untreated clones, are the mean ± SD of three independent experiments. (E) Effects of APE1 acetylation mutants on cell viability after TBHP treatment in APE1WT-, APE1K4pleA-, and APE1K4pleR-expressing cells grown in medium supplemented with Doxy to silence APE1 endogenous protein. Cells were treated with increasing concentrations of TBHP for 6 h, and the cytotoxic effects were determined by the MTS assay. Each point, shown as percentage viability with respect to untreated clones, represents the mean ± SD of four observations, repeated in at least two independent assays. Asterisks represent a significant difference between APE1K4pleA and APE1K4pleR mutants.
FIGURE 6:
FIGURE 6:
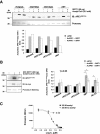
SIRT1 deacetylase activity on K6/K7 depends on the charged status of K27/K31/K32/K35 residues. (A) K6/K7 acetylation, modulated by SIRT1, depends on the charged status of K27/K31/K32/K35 residues. Western blot analysis on purified recombinant APE1 proteins in vitro acetylated with acetyl-CoA and then incubated in the presence/absence of recombinant GST-SIRT1, as indicated. The analysis was carried out using an antibody specific for acetylated K6/K7 APE1 (top). The histogram reports data obtained from densitometric quantification of the bands for each APE1 protein after normalization on Ponceau S staining (bottom). Data shown are the mean of two independent experimental sets whose variation was <10%. (B) SIRT1 deacetylates rAPE1 at K27/K31/K32/K35. Left, Western blot analysis on the in vitro–acetylated and deacetylated purified recombinant APE1, further subjected to MS analysis (Supplemental Table S1). rAPE1WT was incubated with 0.5 mM acetyl-CoA and then with recombinant SIRT1 protein, as shown. Samples were separated onto 10% SDS–PAGE, and Western blot analysis was performed by using the anti-APE1K27-35Ac antibody. Ponceau S staining was used as loading control. Right, the histogram shows the densitometric quantification of the band intensities, after normalization to the nonacetylated APE1 form, of the in vitro–acetylated and deacetylated purified APE1 mutants. Data are the mean ± SD of three independent replicates. Asterisks represent a significant difference. (C) The acetylated APE1 25–38 peptide is a substrate of SIRT1 activity. Purified APE1 peptides (25–38) either in fully acetylated form at K27/K31/K32/K35 residues or not acetylated were analyzed as competitors in an in vitro deacetylase SIRT1 assay based on a fluorogenic acetylated peptide derived from p53 (region 379–382). Dose–response signals allowed an estimated IC50 value of 4.6 ± 0.3 μM of the acetylated APE1 25–38 region with respect to the p53 peptide.
FIGURE 7:
FIGURE 7:
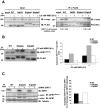
Cross-talk between the acetylation status of K27/K31/K32/K35 and K6/K7 residues through SIRT1. (A) Positive charges at K27/K31/K32/K35 residues strongly influence the stability of SIRT1 binding to APE1. Western blot analysis performed on total cell extracts (left) and on immunoprecipitated material (right) from HeLa cells cotransfected with c-myc–tagged SIRT1 and APE1WT, APE1NΔ33, APE1K4pleA, or APE1K4pleR FLAG-tagged proteins and treated with 0.5 mM MMS for 8 h. Coimmunoprecipitated amounts of SIRT1 normalized with respect to APE1WT or APE1K4pleR, respectively, are indicated under each relative bar. Ponceau S staining was used as loading control. (B) Acetylation level of K6/K7 in APE1K4pleA mutant is higher than that of APE1WT both under basal conditions and after MMS treatment. Western blot analysis on CoIP material after MMS treatment from HeLa cells transfected with APE1WT and FLAG-tagged mutants is shown. The histogram indicates the relative amount of acetylated APE1K6/K7 in the different clones obtained from the densitometric quantification of acetylated APE1 bands, normalized with respect to the amount of APE1 FLAG-tagged immunopurified protein. Data shown are the mean of two independent experimental sets whose variation was <10%. (C) SIRT1 siRNA knockdown increases APE1 K6/K7 acetylation. HeLa stable clones expressing APE1WT, APE1K4pleA, and APE1K4pleR were transfected with siRNA against SIRT1 protein or control siRNA. Western blot analysis was performed to detect differential amount of the acetylated K6/K7 APE1 after SIRT1 silencing. Arrows highlight bands of ectopic APE1 protein form; β-tubulin was used as a loading control. The histogram shows densitometric quantification of acetylated K6/K7 APE1 form. Data are expressed as percentage of induction of the acetylated K6/K7 APE1 after SIRT1 silencing after normalization for the total APE1 protein levels. Data shown are the mean of two independent experimental sets whose variation was <10%.
FIGURE 8:
FIGURE 8:
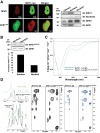
Nucleolar APE1 hypoacetylated on K6/K7 and conformational impact of acetylation at K27/K31/K32/K35 on APE1 local structure. (A) SIRT1 resides within the nucleoplasm of HeLa cells. Left, confocal microscopy of HeLa cells cotransfected with green fluorescent protein–fused APE1 (APE1GFP) and c-myc-SIRT1 after fixing and staining with antibodies against NPM1 (red) and c-myc-SIRT1 (top, green; bottom, red). SIRT1, clearly excluded from nucleoli, colocalizes with APE1 in the nucleoplasm. The inner part of nucleoli, marked in the granular zone by NPM1, is negative for SIRT1. Right, biochemical isolation of nucleoli confirms that SIRT1 localizes in the nucleoplasmic fraction and it is excluded from nucleoli, where nucleolin, NPM1, and APE1 reside (see Materials and Methods for details). Nucleolin was used as a positive control for nuclear and nucleolar compartment. (B) Acetylated K6/K7-containing APE1 is enriched within the nucleoplasmic compartment with respect to nucleoli. After normalization for total APE1 protein amount, the levels of acetylated APE1 in nucleolar and nucleoplasmic fractions were analyzed through Western blotting. APE1 acetylated at K6/K7 residues is predominately present within the nucleoplasmic fraction, whereas it is reduced in the nucleolar fraction. The histogram indicates the relative percentage amount of acetylated APE1 obtained from the densitometric quantification of acetylated APE1 bands normalized with respect to the amount of total APE1 in each fraction. Each bar represents the mean of two independent experiments whose variation was <10%. (C) CD spectra of the APE1(14–38) and APE1(14–38)K27/31/32/35Ac peptides in 10 mM phosphate buffer, pH 7. (D) Comparison of 1D (left), 2D [1H, 1H] TOCSY (middle), and 2D [1H, 1H] ROESY (right) spectra of APE1(14–38) and APE1(14–38)K27/31/32/35Ac peptides in 10 mM phosphate buffer, pH 7.0. Two different expansions of the proton 1D spectrum are shown; the region between 0.8 and 2.4 ppm, in the lower inset, contains signals from side-chain protons. Acetyl methyl groups originate a peak around 2 ppm, which can be clearly seen in the spectrum of the acetylated peptide; peaks of backbone and side-chain NH atoms appear between 7.0 and 8.8 ppm in the upper inset. For 2D [1H, 1H] TOCSY and 2D [1H, 1H] ROESY experiments the HN-aliphatic protons correlation region of the spectra are reported.

Similar articles

Cited by

References

    1. Arena S, Renzone G, Novi G, Paffetti A, Bernardini G, Santucci A, Scaloni A. Modern proteomic methodologies for the characterization of lactosylation protein targets in milk. Proteomics. 2010;10:3414–3434. - PubMed
    1. Bapat A, Fishel ML, Kelley MR. Going Ape as an approach to cancer therapeutics. Antioxid Redox Signal. 2009;11:651–668. - PMC - PubMed
    1. Bapat A, Glass LS, Luo M, Fishel ML, Long EC, Georgiadis MM, Kelley MR. Novel small-molecule inhibitor of apurinic/apyrimidinic endonuclease 1 blocks proliferation and reduces viability of glioblastoma cells. J Pharmacol Exp Ther. 2010;334:988–998. - PMC - PubMed
    1. Barnes T, Kim WC, Mantha AK, Kim SE, Izumi T, Mitra S, Lee CH. Identification of apurinic/apyrimidinic endonuclease 1 (APE1) as the endoribonuclease that cleaves c-myc mRNA. Nucleic Acids Res. 2009;37:3946–3958. - PMC - PubMed
    1. Bartels C, Xia T, Billeter M, Gunthert P, Wüthrich K. The program XEASY for computer-supported NMR spectral analysis of biological macromolecules. J Biomol NMR. 1995;6:1–10. - PubMed

Publication types

MeSH terms