. 2013 Nov;23(11):2690-9.
doi: 10.1093/cercor/bhs257. Epub 2012 Aug 23.

Differential wiring of layer 2/3 neurons drives sparse and reliable firing during neocortical development

Affiliations

Differential wiring of layer 2/3 neurons drives sparse and reliable firing during neocortical development

Brett L Benedetti et al. Cereb Cortex. 2013 Nov.

Abstract

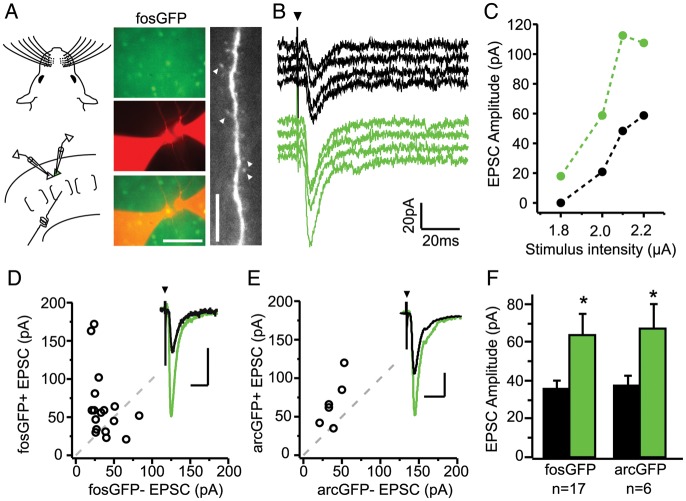
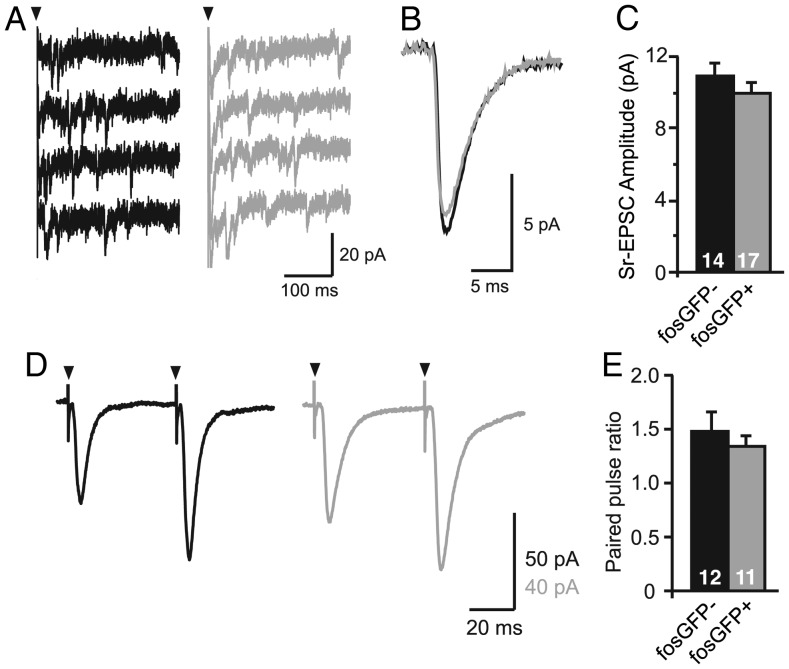
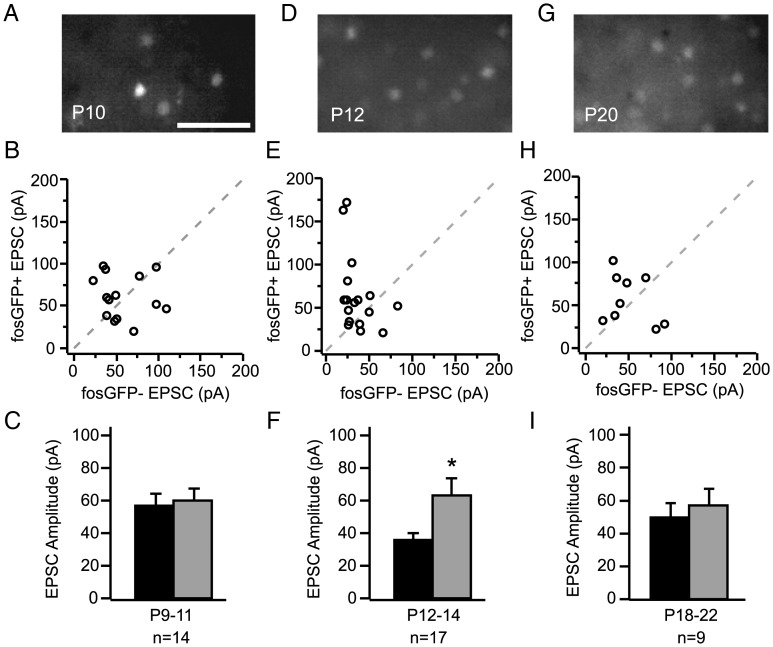
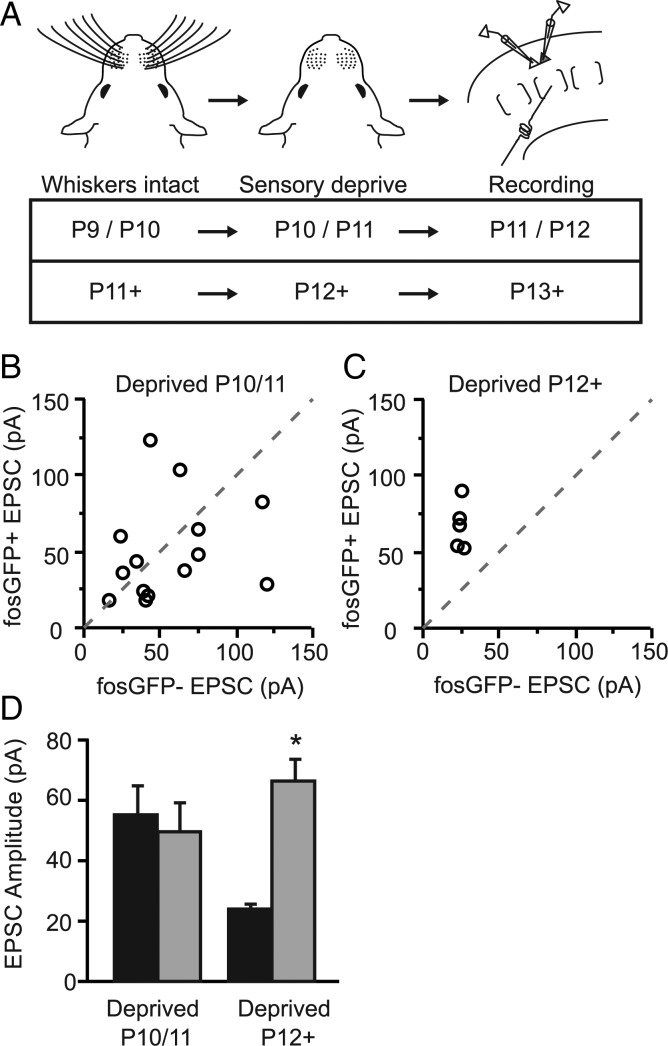
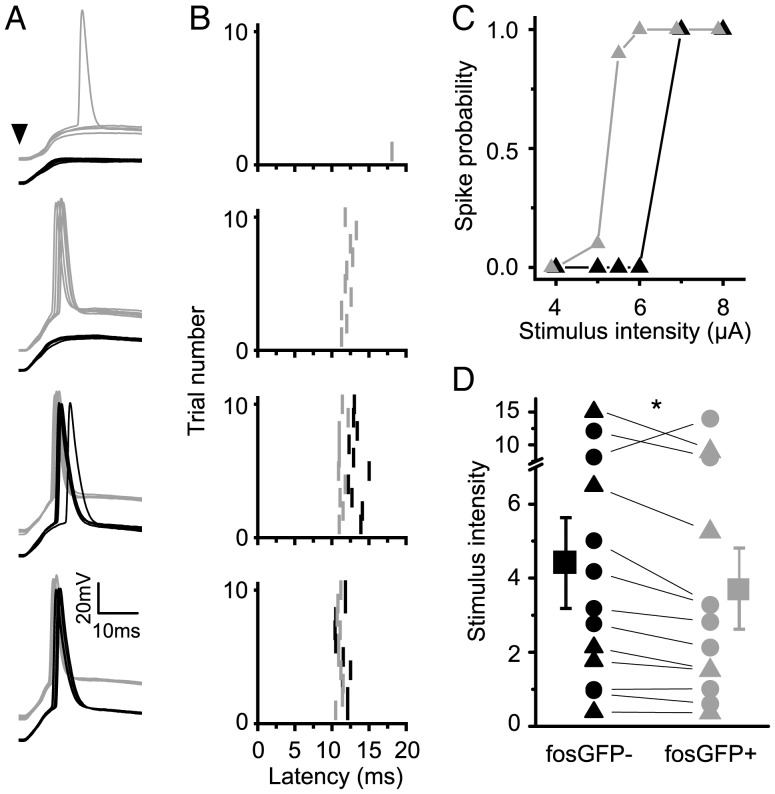
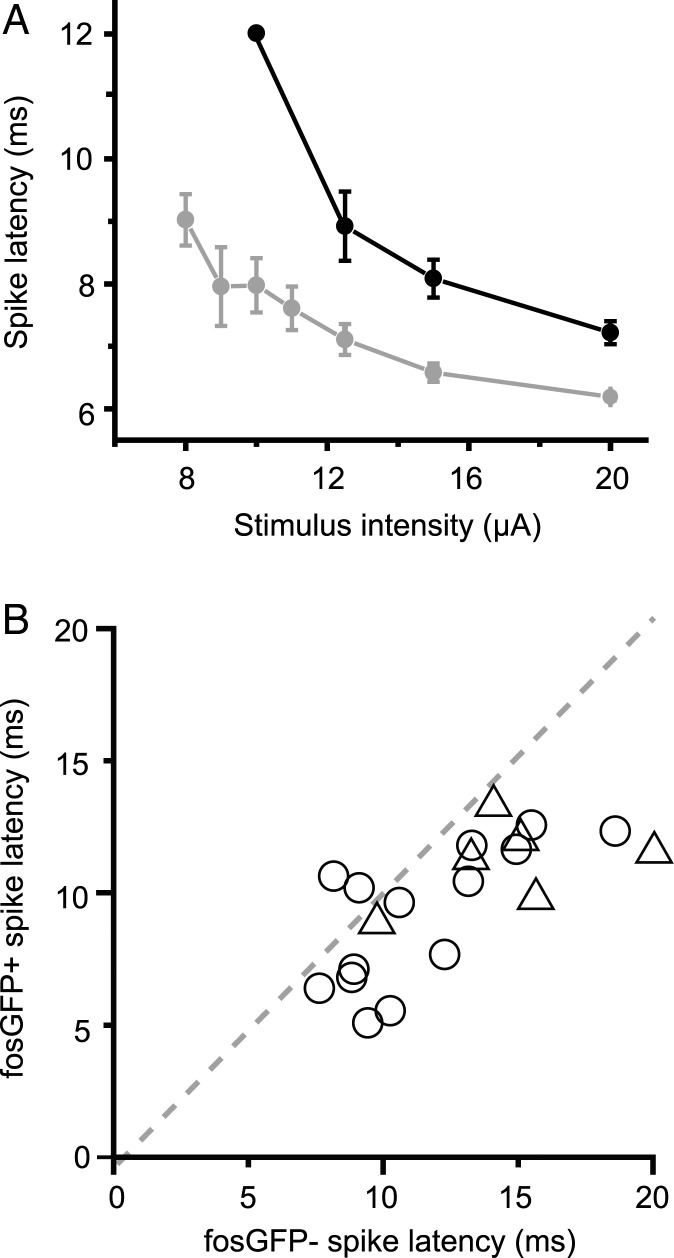
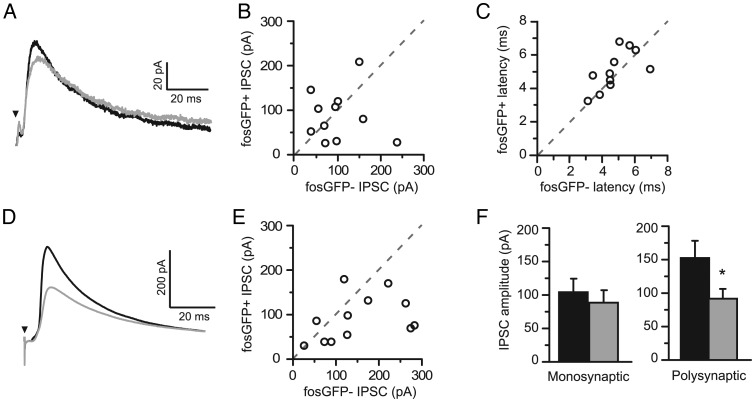
Sensory information is transmitted with high fidelity across multiple synapses until it reaches the neocortex. There, individual neurons exhibit enormous variability in responses. The source of this diversity in output has been debated. Using transgenic mice expressing the green fluorescent protein coupled to the activity-dependent gene c-fos, we identified neurons with a history of elevated activity in vivo. Focusing on layer 4 to layer 2/3 connections, a site of strong excitatory drive at an initial stage of cortical processing, we find that fluorescently tagged neurons receive significantly greater excitatory and reduced inhibitory input compared with neighboring, unlabeled cells. Differential wiring of layer 2/3 neurons arises early in development and requires sensory input to be established. Stronger connection strength is not associated with evidence for recent synaptic plasticity, suggesting that these more active ensembles may not be generated over short time scales. Paired recordings show fosGFP+ neurons spike at lower stimulus thresholds than neighboring, fosGFP- neurons. These data indicate that differences in circuit construction can underlie response heterogeneity amongst neocortical neurons.

Keywords: AMPA receptors; activity-dependent gene expression; critical period; somatosensory; subnetworks.


Figures

Figure 1.
Figure 1.
Excitatory synaptic drive is stronger onto fosGFP+ neurons. (A) Experimental configuration for dual whole-cell recordings in acute brain slices from unstimulated, cage-reared fosGFP mice (left). FosGFP expression used to target whole-cell patch pipettes to fosGFP+ and fosGFP− pyramidal neurons (middle). Scale bar, 50 μm. Apical dendrite of a recorded neuron filled with Alexa-568 to reveal the presence of dendritic spines (arrowheads; right). Scale bar, 10 μm. (B) Example responses evoked by layer 4 (L4) stimulation (4 trials, 0.1 Hz) recorded simultaneously in a fosGFP− (black) and fosGFP+ (green) neuron. Arrowhead indicates stimulus onset. Stimulus artifact has been truncated for clarity. (C) Stimulus response curve of excitatory synaptic strength in one pair of L2/3 neurons evoked by increasing stimulus strength in L4. (D) Scatter plot comparison of mean EPSC amplitudes recorded from 17 fosGFP+/− pairs between P12–14. Dashed line indicates unity. Inset shows the example average EPSC from one pair, scale bars, 40 pA, 20 ms. (E) Scatter plot comparison of EPSC amplitudes recorded from 6 arcGFP+/− pairs. Inset shows example average EPSC from one pair, scale bars, 20 pA, 20 ms. (F) Mean ± SEM evoked EPSC amplitudes for fosGFP+/− and arcGFP pairs+/−. Asterisk indicates P < 0.05.
Figure 2.
Figure 2.
Properties of L4 to 2/3 excitatory synapses onto fosGFP+/− neurons. (A) L4-evoked miniature EPSCs (4 trials) recorded in a fosGFP− (black) or fosGFP+ (gray) L2/3 pyramidal cell in Sr-ACSF to desynchronize synaptic release. (B) Average Sr-EPSC recorded from all fosGFP− and all fosGFP+ neuron. (C) Mean ± SEM Sr-EPSC amplitude (n = 17 fosGFP+, n = 14 fosGFP−). (D) Example responses from fosGFP− (black) and fosGFP+ (gray) neurons to repetitive L4 stimulation (2 pulses, 20 Hz) used to calculate paired-pulse ratios. (E) Summary plot of mean ± SEM paired-pulse ratios for fosGFP− and fosGFP+ cells recorded at P11 to P14.
Figure 3.
Figure 3.
Excitation onto fosGFP+ and fosGFP− neurons is balanced in early development. (A) FosGFP expression in an acute brain slice from P10 mouse. Scale bar, 50 μm. (B) Scatter plot comparison of EPSC amplitudes recorded in fosGFP+/− pairs between P9 and P11. (C) Summary plot of average evoked EPSC amplitudes for the same cells as in (B). (DF) FosGFP expression, scatter plot, and summary of EPSC amplitudes for fosGFP+/− pairs recorded between P12 and P14. Asterisk indicates P < 0.05. Data are replotted from Figure 1D and F. (GI) FosGFP expression, scatter plot, and summary of EPSC amplitudes for fosGFP+/− pairs recorded between P18 and P22.
Figure 4.
Figure 4.
Asymmetric wiring requires sensory input to be established. (A) Experimental timelines used for sensory deprivation and brain slice recordings. (B) Scatter plot comparison of EPSC amplitudes recorded in fosGFP+/− pairs following 24 h of whisker deprivation initiated at P10/11. (C) Scatter plot comparison of EPSC amplitudes recorded in fosGFP+/− pairs following 24 h of whisker deprivation initiated after P11. (D) Summary histogram of evoked EPSC amplitudes from fosGFP+/− pairs (gray and black, respectively) following deprivation. Asterisk indicates P < 0.05.
Figure 5.
Figure 5.
FosGFP+ cells fire more reliably to afferent stimulation. (A) Sample traces of whole-cell recordings in which responses evoked by L4 stimulation (at 4 different stimulation intensities 50, 60, 70, and 80 µA) were recorded in a pair of layer 2/3 fosGFP− (black) and fosGFP+ (gray) neurons. Arrowhead indicates stimulus onset. Stimulus artifacts have been truncated for clarity. (B) Raster plots of spike latencies showing the trial-by-trial responses of each neuron. Stimulus onset occurs at 0 ms. (C) Stimulus response curves of spiking probability for the example pair shown in A–B for six stimulation intensities. (D) Scatter plot of fosGFP+/− pairs (black triangles: whole-cell recordings; black circles: cell-attached recordings) where the value plotted on the y-axis is the extrapolated stimulus intensity corresponding to a 50% probability of neuronal firing. Asterisk indicates P < 0.05.
Figure 6.
Figure 6.
FosGFP+ neurons fire at shorter latency and with less jitter. (A) Spike latency at seven stimulation intensities for a single pair of fosGFP− (black) and fosGFP+ (gray) cells. Note that the standard deviation of spike times is reduced for the fosGFP+ cell. (B) Comparison of spike latencies for all fosGFP+/− pairs (Triangles: whole-cell recording; circles: juxta-cellular recording; values from stimulation intensities where at least one cell was firing on every stimulus trial; n = 20 pairs). Dashed line indicates unity.
Figure 7.
Figure 7.
FosGFP+ cells receive less synaptic inhibition. (A) Average sample traces of monosynaptic inhibitory post-synaptic currents (IPSCs) evoked by L4 stimulation in the presence of APV and NBQX recorded simultaneously in a pair of fosGFP+/− neurons (gray and black, respectively). (B) Scatter plot comparison of monosynaptic IPSC amplitudes for 11 fosGFP+/− pairs. (C) Scatter plot comparison of IPSC onset latency for the same pairs as in B. (D) Average sample traces of polysynaptic IPSCs evoked by L4 stimulation recorded in a fosGFP+/− pairs voltage clamped to the experimentally determined EPSC reversal potential (+10 mV) in the absence of any drugs to block excitatory synaptic transmission. (E) Scatter plot comparison of polysynaptic IPSC amplitudes for 12 fosGFP+/− pairs. (F) Summary histograms of mono- (left) and polysynaptic (right) IPSC amplitudes. Asterisk indicates P < 0.05.

References

    1. Arieli A, Sterkin A, Grinvald A, Aertsen A. Dynamics of ongoing activity: explanation of the large variability in evoked cortical responses. Science (New York, NY) 1996;273:1868–1871. - PubMed
    1. Aronoff R, Matyas F, Mateo C, Ciron C, Schneider B, Petersen CC. Long-range connectivity of mouse primary somatosensory barrel cortex. Eur J Neurosci. 2010;31:2221–2233. - PubMed
    1. Barth AL, Gerkin RC, Dean KL. Alteration of neuronal firing properties after in vivo experience in a FosGFP transgenic mouse. J Neurosci. 2004;24:6466–6475. - PMC - PubMed
    1. Barth AL, Poulet JF. Experimental evidence for sparse firing in the neocortex. Trends Neurosci. 2012;35:345–355. - PubMed
    1. Bender KJ, Allen CB, Bender VA, Feldman DE. Synaptic basis for whisker deprivation-induced synaptic depression in rat somatosensory cortex. J Neurosci. 2006;26:4155–4165. - PMC - PubMed

Publication types