

Reproducibility and clinical correlations of post-treatment changes on CT of prostate cancer bone metastases treated with chemotherapy
- PMID: 22919006
- PMCID: PMC3487055
- DOI: 10.1259/bjr/27266976
Reproducibility and clinical correlations of post-treatment changes on CT of prostate cancer bone metastases treated with chemotherapy
Abstract
Objectives: The objective of this study was to determine whether, in patients with prostate cancer (PCa) bone metastases receiving chemotherapy, early post-treatment changes on CT are reproducible and associated with clinical outcomes.
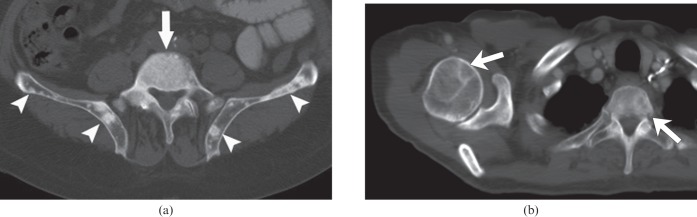
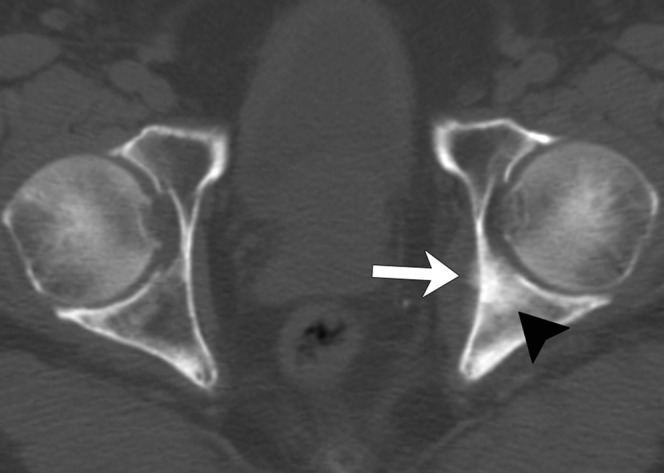
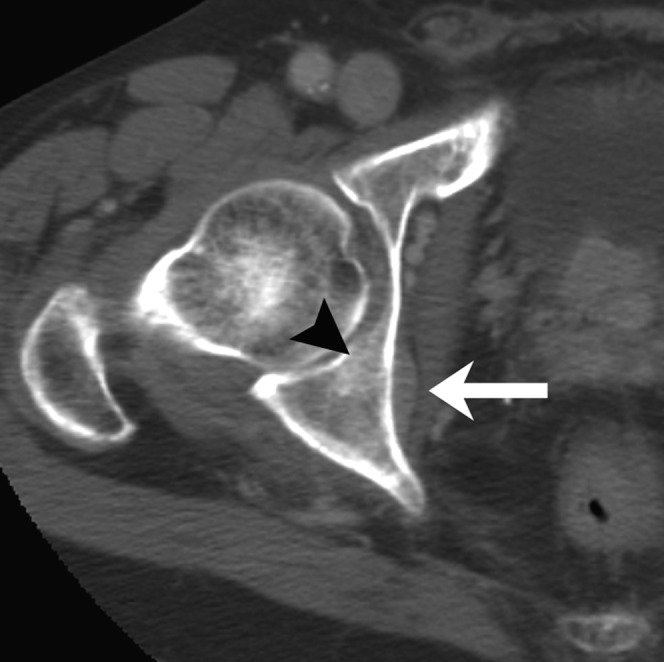
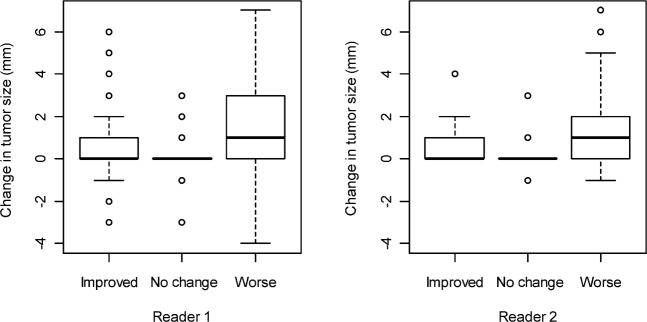
Methods: Blinded to outcomes, two radiologists with 1 year and 5 years of experience independently reviewed CTs obtained before and 3 months after chemotherapy initiation in 38 patients with bone metastases from castration-resistant PCa, recording the size, matrix and attenuation of ≤5 lesions; presence of new lesions, extraosseous components, periosteal reactions and cortical thickening; and overall CT assessment (improved, no change or worse). Kappa statistics were used to assess inter-reader agreement; the Kruskal-Wallis test and Cox regression model were used to evaluate associations.
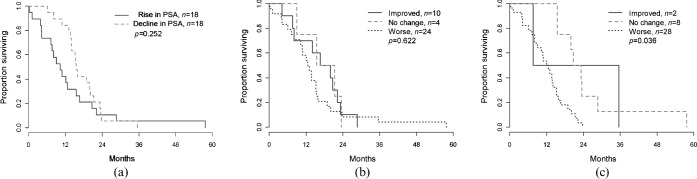
Results: Inter-reader agreement was low/fair for size change (concordance correlation coefficient=0.013), overall assessment and extraosseous involvement (κ=0.3), moderate for periosteal reaction and cortical thickening (κ=0.4-0.5), and substantial for CT attenuation (κ=0.7). Most metastases were blastic (Reader 1, 58%; Reader 2, 67%) or mixed lytic-blastic (Reader 1, 42%; Reader 2, 34%). No individual CT features correlated with survival. Readers 1 and 2 called the disease improved in 26% and 5% of patients, unchanged in 11% and 21%, and worse in 63% and 74%, respectively, with 64% interreader agreement. Overall CT assessment did not correlate with percentage change in prostate-specific antigen level. For the more experienced reader (Reader 2), patients with improved or unchanged disease had significantly longer median survival (p=0.036).
Conclusions: In PCa bone metastases, interreader agreement is low in overall CT post-treatment assessment and varies widely for individual CT features. Improved or stable disease identified by an experienced reader is statistically associated with longer survival.
Figures
Similar articles
-
More advantages in detecting bone and soft tissue metastases from prostate cancer using 18F-PSMA PET/CT.Hell J Nucl Med. 2019 Jan-Apr;22(1):6-9. doi: 10.1967/s002449910952. Epub 2019 Mar 7. Hell J Nucl Med. 2019. PMID: 30843003
-
[Diagnostic performance of bone scintigraphy and (11)C-Choline PET/CT in the detection of bone metastases in patients with biochemical recurrence of prostate cancer].Rev Esp Med Nucl Imagen Mol. 2015 May-Jun;34(3):155-61. doi: 10.1016/j.remn.2014.08.001. Epub 2014 Nov 15. Rev Esp Med Nucl Imagen Mol. 2015. PMID: 25443648 Spanish.
-
Quantitative contrast-enhanced CT attenuation evaluation of osseous metastases following chemotherapy.Skeletal Radiol. 2017 Oct;46(10):1385-1395. doi: 10.1007/s00256-017-2706-6. Epub 2017 Jun 30. Skeletal Radiol. 2017. PMID: 28667362
-
Prostate-specific membrane antigen-positron emission tomography/computed tomography (PSMA-PET/CT)-guided stereotactic ablative body radiotherapy for oligometastatic prostate cancer: a single-institution experience and review of the published literature.BJU Int. 2019 Nov;124 Suppl 1:19-30. doi: 10.1111/bju.14886. Epub 2019 Sep 11. BJU Int. 2019. PMID: 31507035 Review.
-
Inter-reader reliability of CT Liver Imaging Reporting and Data System according to imaging analysis methodology: a systematic review and meta-analysis.Eur Radiol. 2021 Sep;31(9):6856-6867. doi: 10.1007/s00330-021-07815-y. Epub 2021 Mar 13. Eur Radiol. 2021. PMID: 33713172
Cited by
-
Inter-rater reliability of the radiographic assessment of simple bone cysts.J Child Orthop. 2019 Apr 1;13(2):226-235. doi: 10.1302/1863-2548.13.180140. J Child Orthop. 2019. PMID: 30996749 Free PMC article.
-
Utility of absolute apparent diffusion coefficient and chemical-shift imaging versus CT attenuation for predicting malignancy from percutaneous bone biopsies.J Med Radiat Sci. 2021 Sep;68(3):220-227. doi: 10.1002/jmrs.463. Epub 2021 Feb 19. J Med Radiat Sci. 2021. PMID: 33607698 Free PMC article.
-
The utility of laparoscopic ultrasound during minimally invasive liver procedures in patients with malignant liver tumors who have undergone preoperative magnetic resonance imaging.Surg Endosc. 2022 Jul;36(7):4939-4945. doi: 10.1007/s00464-021-08849-5. Epub 2021 Nov 3. Surg Endosc. 2022. PMID: 34734301
References
-
- American Cancer Society Cancer facts and figures 2011. Atlanta, GA: American Cancer Society; 2011
-
- World Health Organization World Health Organization handbook for reporting results of cancer treatment. WHO offset publication no. 48. Geneva, Switzerland: World Health Organization; 1979
-
- Therasse P, Arbuck SG, Eisenhauer EA, Wanders J, Kaplan RS, Rubinstein L, et al. New guidelines to evaluate the response to treatment in solid tumors. European Organization for Research and Treatment of Cancer, National Cancer Institute of the United States, National Cancer Center of Canada. J Natl Cancer Inst 2000;92:205–16 - PubMed
-
- Eisenhauer EA, Therasse P, Bogaerts J, Schwartz LH, Sargent D, Ford R, et al. New response evaluation criteria in solid tumours: revised RECIST guideline (version 1.1). Eur J Cancer 2009;45:228–47 - PubMed
MeSH terms
LinkOut - more resources
Full Text Sources
Medical
Research Materials
