. 2012 Oct 11;120(15):3152-62.
doi: 10.1182/blood-2012-04-422758. Epub 2012 Aug 23.

Endothelial cells provide an instructive niche for the differentiation and functional polarization of M2-like macrophages

Affiliations

Endothelial cells provide an instructive niche for the differentiation and functional polarization of M2-like macrophages

Huanhuan He et al. Blood. .

Abstract

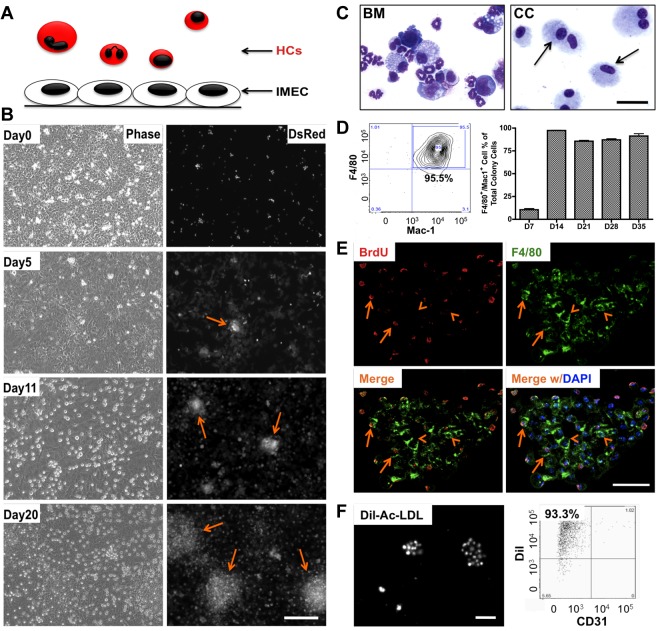
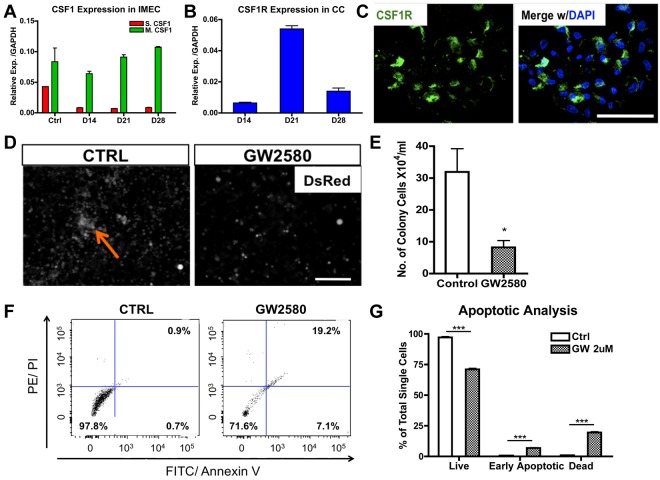
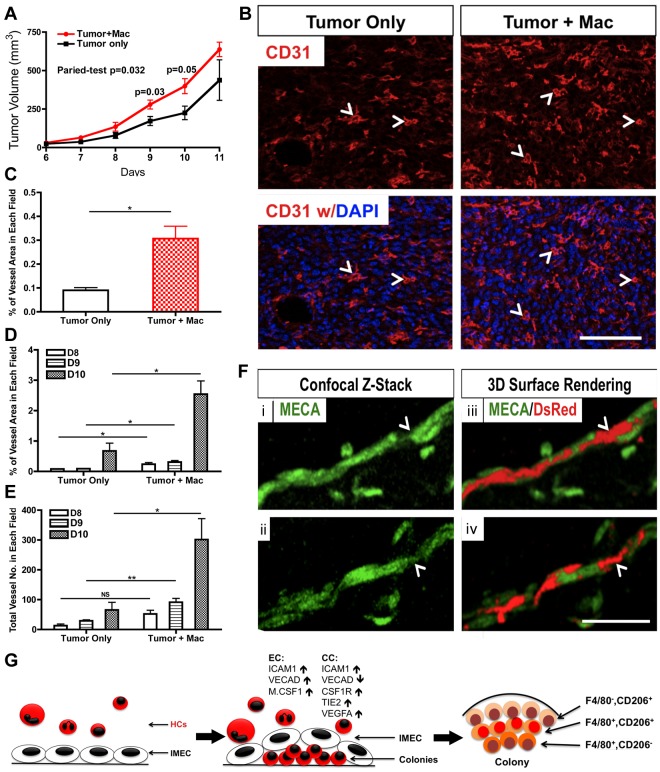
Endothelial cells and macrophages are known to engage in tight and specific interactions that contribute to the modulation of vascular function. Here we show that adult endothelial cells provide critical signals for the selective growth and differentiation of macrophages from several hematopoietic progenitors. The process features the formation of well-organized colonies that exhibit progressive differentiation from the center to the periphery and toward an M2-like phenotype, characterized by enhanced expression of Tie2 and CD206/Mrc1. These colonies are long-lived depending on the contact with the endothelium; removal of the endothelial monolayer results in rapid colony dissolution. We further found that Csf1 produced by the endothelium is critical for the expansion of the macrophage colonies and that blockade of Csf1 receptor impairs colony growth. Functional analyses indicate that these macrophages are capable of accelerating angiogenesis, promoting tumor growth, and effectively engaging in tight associations with endothelial cells in vivo. These findings uncover a critical role of endothelial cells in the induction of macrophage differentiation and their ability to promote further polarization toward a proangiogenic phenotype. This work also highlights some of the molecules underlying the M2-like differentiation, a process that is relevant to the progression of both developmental and pathologic angiogenesis.


Figures

Figure 1
Figure 1
Endothelial cells induce differentiation and expansion of macrophages in vitro. (A) Schematic representation of the coculture system that includes murine hematopoietic cells (HCs) and immortalized mouse endothelial cells (IMECs). All HCs express DsRed fluorescent protein. (B) Phase contrast (left) and fluorescent (right) micrographs depict the formation of DsRed+ colonies (arrow) during coculture. Note that the colonies were phase-dim or invisible under phase view. Scale bar, 200 μm. (C) Photomicrographs of isolated bone marrow (BM) cells and cells from day 27 colonies (CC, arrow) after May-Grünwald-Giemsa staining. Scale bar, 50 μm. (D) FACS profile (left) indicates that the large majority of cells in the colonies were F4/80+/Mac-1+ (n = 3). (E) Fluorescent micrographs of bromodeoxyuridine (BrdU) staining indicating active proliferation within the colony. Day 10 colonies were pulse-labeled with BrdU for 8 hours and then costained for anti-BrdU (red) and anti-F4/80 (green) antibodies. Arrow, cells positive for both F4/80 and BrdU. Arrowhead indicates F4/80+ cells not stained for BrdU. DAPI indicates staining for nucleus (blue). Scale bar, 50 μm. (F) Colony cells uptake DiI-ac-LDL. Cells were incubated with 10 μg/mL DiI-ac-LDL for 4 hours, followed by fluorescent microscopy (left). (Right) FACS profile shows the majority colony cells take up Dil-ac-LDL. CD31, to exclude possible IMEC contamination. Scale bar, 200 μm.
Figure 2
Figure 2
Direct contact with the endothelium is required for the formation and maintenance of macrophage colonies. (A) Schematic representation of the colonies as they take residence under the endothelial monolayer. (B) Confocal 3D reconstruction of the DsRed colonies (arrows) growing underneath the IMEC layer. Composite x-y sections and a single z-section are shown. Scale bar, 50 μm. (C) Ultrastructural analysis of cells cocultured for 28 days by transmission electron microscopy. (Bottom) Magnified micrograph reveals direct contact (arrows) between the 2 cell types. EC indicates endothelial cell; and Mφ, macrophage-like cell. Scale bar, 4 μm. (D) Colonies disaggregate (arrow) after the removal of IMEC layer for 1 day, depicted by phase contrast and fluorescent micrographs (left). Colonies with IMECs were maintained (right). Scale bar, 200 μm. (E) Colonies failed to form via transwells. (Left) Cocultures of HCs and IMECs separated by the transwell (0.4-μm pore size). (Middle) Cocultures through direct contact. Arrows indicate colonies. (Right) Quantification of colony number at day 10 of coculture (n = 3). Scale bar, 200 μm. (F) Real time PCR quantification of ICAM1, VCAM1, and VE-Cadherin in colonies. Ctrl indicates bone marrow–derived macrophages with 5 ng/mL IL-4 stimulated for 24 hours (n = 6). (G) Corresponding cell adhesion molecules (CAMs) expression in IMECs. Ctrl indicates IMECs in the absence of coculture (n = 6; *P < .05; **P < .01; ***P < .001; unpaired Student t test).
Figure 3
Figure 3
CSF1 is essential for the expansion of macrophage colonies. (A) Membrane-bound Csf1 but not secreted Csf1 is prevalently expressed in IMECs by real-time PCR analysis. Ctrl, IMECs in the absence of coculture (n = 6). (B) Csf1 receptor (Csf1r) transcripts are highly expressed in colony cells (n = 6). (C) Immunolocalization of Csf1r (green) on a representative colony from day 10 coculture. DAPI indicates staining for nucleus (blue). Scale bar, 50 μm. (D) GW2580, a CSF1R inhibitor, significantly impairs colony emergence and growth. Coculture was treated with GW2580 (2μM) for 7 days. Ctrl indicates coculture exposed to vehicle. Arrow indicates a colony. Scale bar, 200 μm. (E) Quantification of colony cell number at day 14 of coculture in the presence or absence of GW2580 treatment (n = 3). (F) Representative dot plots showing increased apoptotic activity on GW2580 treatment. Colony cells from day 14 coculture treated with GW2580 (2μM) or vehicle were stained for propidium iodide (PI) and annexin V. (G) Apoptotic analysis of colony cells on GW2580 or vehicle treatment (n = 3; *P < .05; ***P < .001; unpaired Student t test).
Figure 4
Figure 4
Endothelial cells impart M2 polarity on colony macrophages. (A) MHCII expression in colony cells is reduced on coculture, as determined by FACS overlay graph (left) and quantification (right; n = 3). (B) Tie2 expression in colony cells is gradually increased over time as shown by FACS overlay graph (left) and quantification (right; n = 3). (C) Colony cells exhibit M2 macrophage markers but not M1 markers, as detected by real-time PCR analysis. Ctrl indicates bone marrow–derived macrophages stimulated with 50 ng/mL LPS (for M1 control) or with 5 ng/mL IL-4 (for M2 control) for 24 hours (n = 6). (D) Colony cells express high level of Vegfa transcripts. (E) Immunolocalization of F4/80 (pan macrophage marker, red) and CD206/Mrc1 (M2 macrophage marker, green) in a macrophage colony. Note that cells in the center of the colony are F4/80+ and CD206; cells on the periphery are F4/80 and CD206+; cells in between are positive for both markers. Colony shown is from day 14 coculture. DAPI indicates staining for nucleus (blue). Scale bar, 50 μm (*P < .05; unpaired Student t test).
Figure 5
Figure 5
IMECs support macrophage differentiation from hematopoietic progenitors. (A) Schematic representation of hematopoietic progenitors evaluated and the time of emergence of macrophage colonies (right). HSPC indicates hematopoietic stem/progenitor cell; G/CMP, granulocyte-macrophage and common myeloid progenitor; and MEP, megakaryocyte-erythroid progenitor. Arrows indicate colonies. Scale bar, 200 μm. (B) Colony cell number at day 28 of cocultures was normalized to the initial number of progenitor cells plated (n = 6). (C) Colony cells from all progenitors moderately display M2 macrophage markers but lack M1 markers. Ctrl indicates colony cells from the coculture of whole bone marrow (WBM) cells and IMECs (n = 6). (D) Colonies from all progenitors expressed CD206/Mrc1 (M2 macrophage marker, green) and F4/80 (pan macrophage marker, red). Colonies shown are from d14 coculture. DAPI indicates staining for nucleus (blue). Scale bar, 100 μm.
Figure 6
Figure 6
Macrophages derived from coculture promote tumor growth and angiogenesis. (A) Colony cells promote tumor growth in wild-type C57BL/6 mice. Mice were injected with RM1 tumor cells (1 × 10⁵) alone or with colony cells (1 × 10⁴; n = 3∼5). (B) Representative pictures of tumor sections stained for CD31 (red). Tumors that were co-injected with colony cells showed a higher vascular density. Arrowhead indicates representative vessel. DAPI indicates staining for nuclei (blue). Scale bar, 100 μm. (C) Quantification (percentage) of vascular area in tumor sections shown in (B; n = 3). (D) Quantification of vessel area in tumor sections from indicated days (n = 3). (E) Quantification of vessel number in tumor sections from indicated days (n = 3). (F) Immunolabeling (i,ii) and 3D surface rendering (iii,iv) of colony cells (DsRed) and vessels (MECA, green) after colony cells and IMECs were injected with matrigel for 7 days. Colony cell (arrowhead) is bridging 2 endothelial cells. Scale bar, 50 μm. (G) Model of IMEC-induced M2 macrophage differentiation (*P < .05; **P < .01; unpaired Student t test).

References

    1. Zovein AC, Hofmann JJ, Lynch M, et al. Fate tracing reveals the endothelial origin of hematopoietic stem cells. Cell Stem Cell. 2008;3(6):625–636. - PMC - PubMed
    1. Chen M, Yokomizo T, Zeigler B, Dzierzak E, Speck N. Runx1 is required for the endothelial to haematopoietic cell transition but not thereafter. Nature. 2009;457(7231):887–891. - PMC - PubMed
    1. Eilken H, Nishikawa S, Schroeder T. Continuous single-cell imaging of blood generation from haemogenic endothelium. Nature. 2009;457(7231):896–900. - PubMed
    1. Lancrin C, Sroczynska P, Stephenson C, Allen T, Kouskoff V, Lacaud G. The haemangioblast generates haematopoietic cells through a haemogenic endothelium stage. Nature. 2009;457(7231):892–895. - PMC - PubMed
    1. Ley K, Laudanna C, Cybulsky MI, Nourshargh S. Getting to the site of inflammation: the leukocyte adhesion cascade updated. Nat Rev Immunol. 2007;7(9):678–689. - PubMed

Publication types

MeSH terms

Substances