. 2012 Nov;22(11):2138-45.
doi: 10.1101/gr.134304.111. Epub 2012 Aug 23.

Guthrie card methylomics identifies temporally stable epialleles that are present at birth in humans

Affiliations

Guthrie card methylomics identifies temporally stable epialleles that are present at birth in humans

Huriya Beyan et al. Genome Res. 2012 Nov.

Abstract

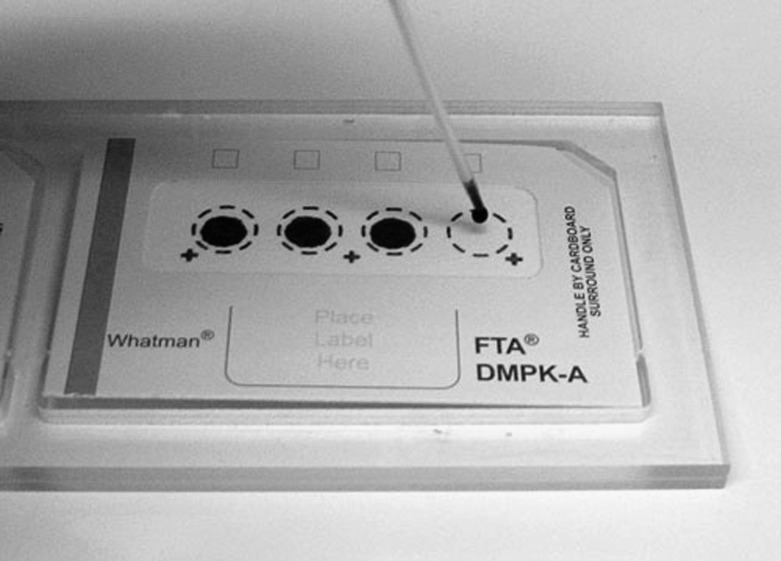
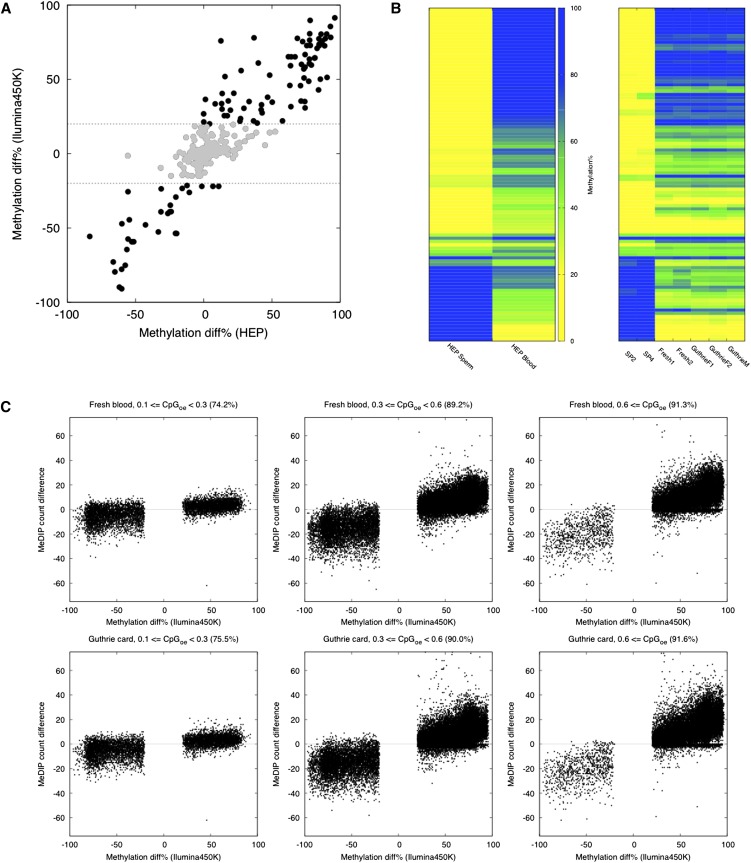
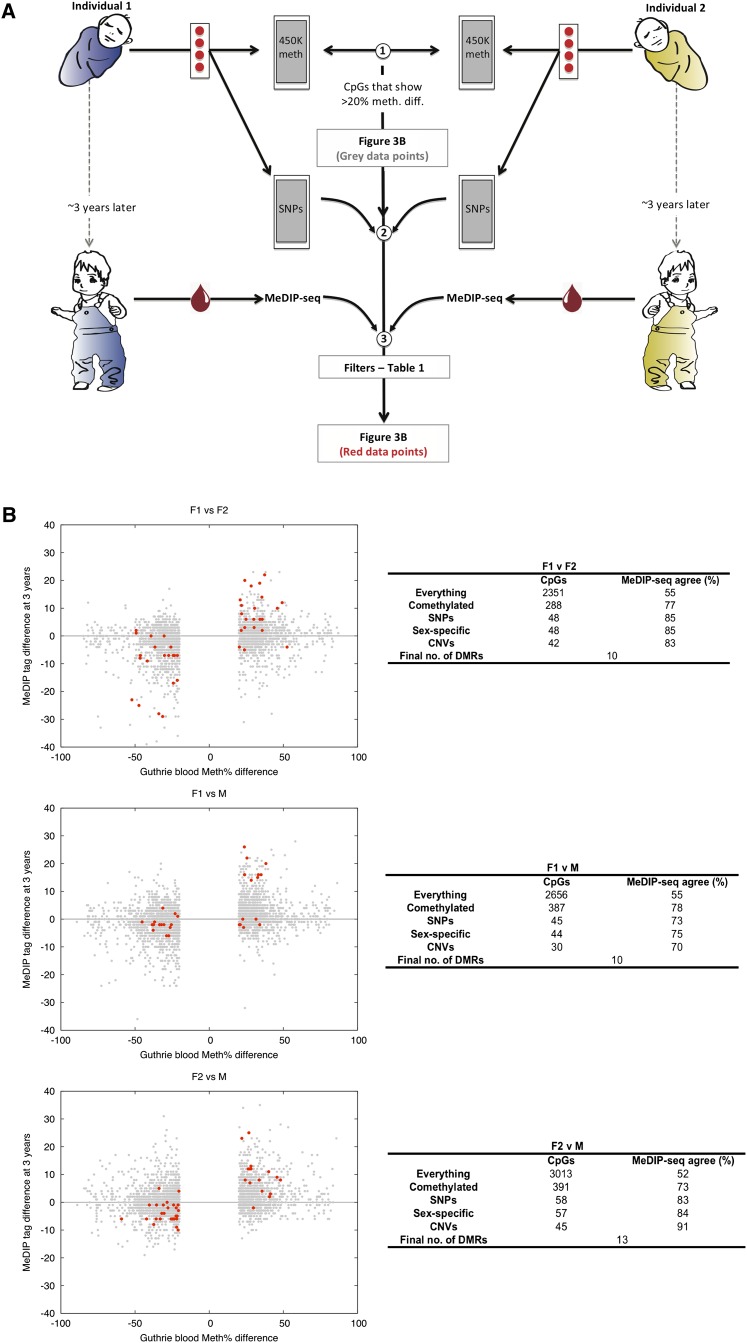
A major concern in common disease epigenomics is distinguishing causal from consequential epigenetic variation. One means of addressing this issue is to identify the temporal origins of epigenetic variants via longitudinal analyses. However, prospective birth-cohort studies are expensive and time consuming. Here, we report DNA methylomics of archived Guthrie cards for the retrospective longitudinal analyses of in-utero-derived DNA methylation variation. We first validate two methodologies for generating comprehensive DNA methylomes from Guthrie cards. Then, using an integrated epigenomic/genomic analysis of Guthrie cards and follow-up samplings, we identify interindividual DNA methylation variation that is present both at birth and 3 yr later. These findings suggest that disease-relevant epigenetic variation could be detected at birth, i.e., before overt clinical disease. Guthrie card methylomics offers a potentially powerful and cost-effective strategy for studying the dynamics of interindividual epigenomic variation in a range of common human diseases.


Figures

Figure 1.
Figure 1.
An example of the type of Guthrie cards used in our study (image from Ake Lernmark).
Figure 2.
Figure 2.
Array and sequencing-based DNA methylomics of Guthrie cards. (A) Comparison of Illumina450K-based “fresh cord blood vs. sperm” tDMRs with “blood vs. sperm” tDMRs identified in the Human Epigenome Project (HEP) (Eckhardt et al. 2006). Plotted are 468 genomic regions (∼200–300 bp in length) common between the HEP and the Illumina450K data sets. Illumina450K-based “fresh cord blood vs. sperm” tDMRs that display <20% methylation differences are shown in gray. R2 = 0.90 (overall), R2 = 0.50 (<20% methylation), both Pearson's. (B) A comparison of fresh cord blood and Guthrie card Illumina450K profiles with HEP data. Shown is methylation data for regions called “blood vs. sperm” tDMRs in the HEP. Each column represents profiles from a separate individual, and 106 different tDMRs are shown. (SP) Sperm. (C) Normalized MeDIP-seq read counts for the “blood vs. sperm” tDMRs identified by the use of Illumina450K-based fresh blood (top) or Guthrie cards (bottom) across a range of CpG densities. Only >20% tDMR methylation differences are shown. The percentage agreement is indicated in each panel. Number of different CpGs represented in each panel: Low CpG, n = 6404; mid-CpG, n = 28,384; high CpG, n = 18,135. Note the numbers are the same for the “Fresh blood” and “Guthrie card” data sets as the differentially methylated CpG sites were called on the Illumina450K arrays.
Figure 3.
Figure 3.
Identification at birth of temporally stable individual-specific DNA methylation variants. (A) Experimental strategy schematic: (1) Guthrie card Illumina450K profiles were generated and >20% interindividual pairwise methylation differences called (sex chromosome data were excluded from all analyses); (2) SNP data were also generated from Guthrie card DNA; (3) a variety of filters (detailed in Table 1) were applied to the Illumina450K profiles, and then validation was performed using MeDIP-seq profiles of blood sampled when the individuals were 3 yr old. (B) Identification of temporally stable interindividual DMRs that exist at birth. (Gray points) Single CpG interindividual differences of >20%; (red points) the filtered set. The number of CpGs remaining after each filter is indicated in the adjoining tables. The final sets of CpGs (red points in the figure) were grouped into “DMRs”—differentially methylated regions. Binomial P-values (calculated at a per-DMR level) for the “Agreement scores” between Illumina450K and MeDIP-seq data are: F1 vs. F2: P = 0.01, F1 vs. M: P = 0.11, F2 vs. M: P = 0.0003.

Similar articles

Cited by

References

    1. Bell JT, Pai AA, Pickrell JK, Gaffney DJ, Pique-Regi R, Degner JF, Gilad Y, Pritchard JK 2011. DNA methylation patterns associate with genetic and gene expression variation in HapMap cell lines. Genome Biol 12: R10 doi: 10.1186/gb-2011-12-1-r10 - PMC - PubMed
    1. Bibikova M, Barnes B, Tsan C, Ho V, Klotzie B, Le JM, Delano D, Zhang L, Schroth GP, Gunderson KL, et al. 2011. High density DNA methylation array with single CpG site resolution. Genomics 98: 288–295 - PubMed
    1. Down TA, Rakyan VK, Turner DJ, Flicek P, Li H, Kulesha E, Gräf S, Johnson N, Herrero J, Tomazou EM, et al. 2008. A Bayesian deconvolution strategy for immunoprecipitation-based DNA methylome analysis. Nat Biotechnol 26: 779–785 - PMC - PubMed
    1. Dubois PC, Trynka G, Franke L, Hunt KA, Romanos J, Curtotti A, Zhemakova A, Heap GA, Adány R, Aromaa A, et al. 2010. Multiple common variants for celiac disease influencing immune gene expression. Nat Genet 42: 295–302 - PMC - PubMed
    1. Eckhardt F, Lewin J, Cortese R, Rakyan VK, Attwood J, Burger M, Burton J, Cox TV, Davies R, Down TA, et al. 2006. DNA methylation profiling of human chromosomes 6, 20 and 22. Nat Genet 38: 1378–1385 - PMC - PubMed

Publication types