. 2012 Mar 13;24(5):812-827.
doi: 10.1021/cm2028367. Epub 2012 Jan 11.

Review of Long-Wavelength Optical and NIR Imaging Materials: Contrast Agents, Fluorophores and Multifunctional Nano Carriers

Affiliations

Review of Long-Wavelength Optical and NIR Imaging Materials: Contrast Agents, Fluorophores and Multifunctional Nano Carriers

Vikram Pansare et al. Chem Mater. .

Abstract

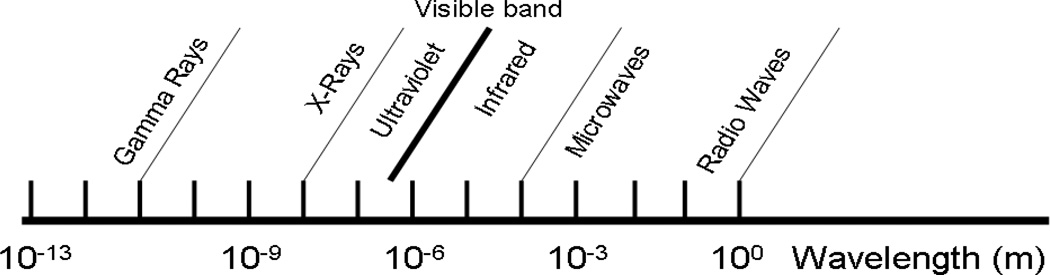
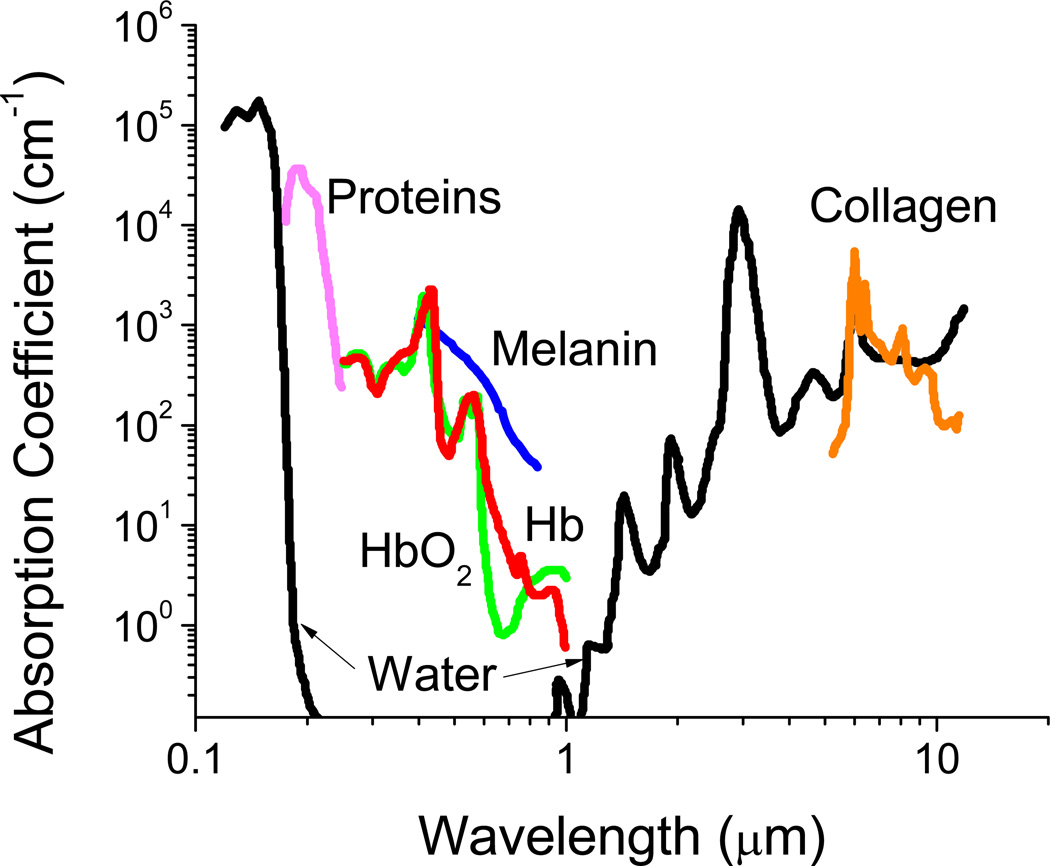
The importance of long wavelength and near infra-red (NIR) imaging has dramatically increased due to the desire to perform whole animal and deep tissue imaging. The adoption of NIR imaging is also growing rapidly due to the availability of targeted biological agents for diagnosis and basic medical research that can be imaged in vivo. The wavelength range of 650-1450 nm falls in the region of the spectrum with the lowest absorption in tissue and therefore enables the deepest tissue penetration. This is the wavelength range we focus on with this review. To operate effectively the imaging agents must both be excited and must emit in this long-wavelength window. We review the agents used both for imaging by absorption, scattering, and excitation (such as fluorescence). Imaging agents comprise both aqueous soluble and insoluble species, both organic and inorganic, and unimolecular and supramolecular constructs. The interest in multi-modal imaging, which involves delivery of actives, targeting, and imaging, requires nanocarriers or supramolecular assemblies. Nanoparticles for diagnostics also have advantages in increasing circulation time and increased imaging brightness relative to single molecule imaging agents. This has led to rapid advances in nanocarriers for long-wavelength, NIR imaging.


Figures

Fig. 1
Fig. 1
The electromagnetic spectrum (adapted from Richards (2001)).
Fig. 2
Fig. 2
Absorbance of various tissue and blood components from 200 nm to 10 µm. The optical imaging window ranging from 650 – 1450 nm represents the range where tissue penetration is greatest. This wavelength range is the focus of this review. Adapted from Boulnois (1986) and Susi (1971).
Fig. 3
Fig. 3
Jablonski diagrams showing the main energy pathways for different modes of fluorescence (energy diagrams not drawn to scale). A – single photon Stokes process (i) photon absorption gives excited state, (ii) internal conversion to S1, first singlet excited state, (iii) fluorescence (emission of photon), (iv) nonradiative decay, (v) intersystem crossing to T1 (‘forbidden’ triplet excited state), (vi) phosphorescence, and (vii) nonradiative decay. B – two-photon upconversion (anti-Stokes process). Excited-state absorption (ESA) proceeds via sequential absorption of two photons to give the excited state and a subsequent emission event. In energy transfer upconversion (ETU), an ion directly absorbs one photon while a neighboring ion absorbs another and transfers the energy to the first ion, resulting in upconversion and emission. Reproduced from Lavis and Raines and Haase and Schafer.
Fig. 4
Fig. 4
Lung clearance of monodisperse polystyrene particles in rats (formula image3 µm | formula image 9 µm | formula image 
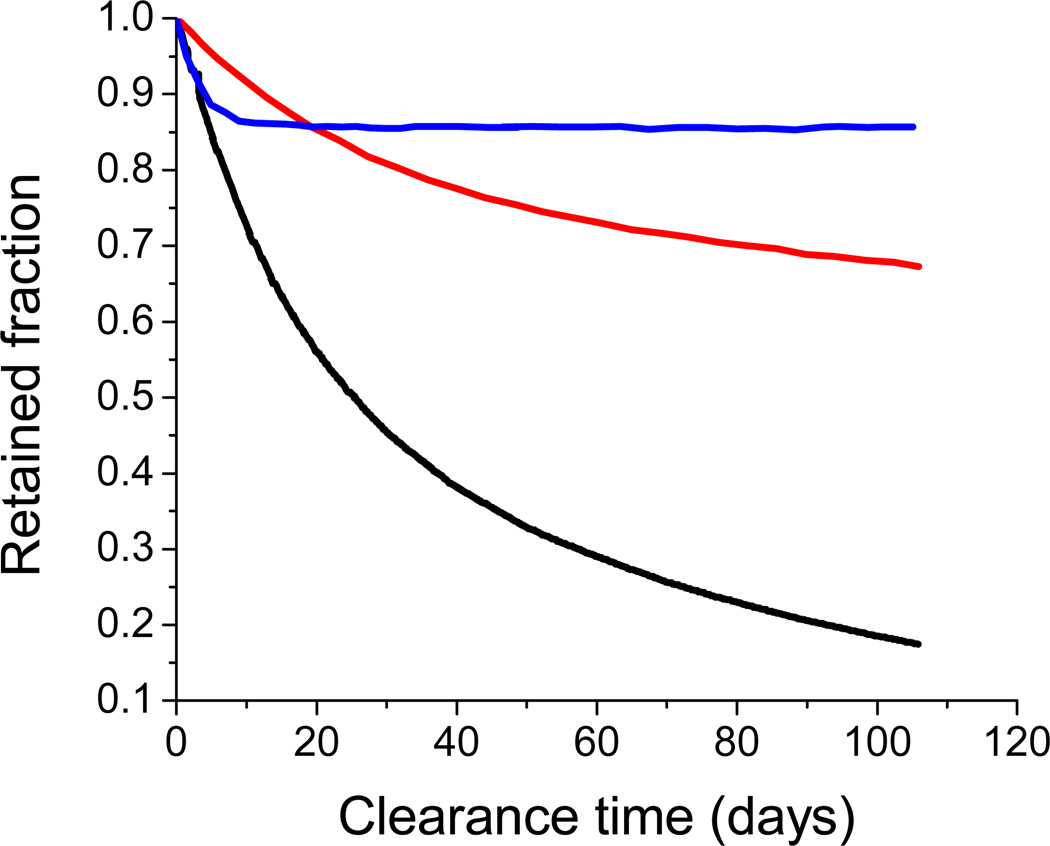
15 µm). Radioactively tagged polystyrene particles, intratracheally administered, were monitored for clearance from the lung. Adapted from Oberdörster (1989) and Snipes (1981).,
Fig. 5
Fig. 5
Predicted absorption spectra for gold ellipsoids with varying aspect ratios (ARs). As seen, increasing the AR monotonically shifts the plasmon resonance band into the NIR, which is ideal for deep tissue imaging. Reproduced from Link, et al.
Fig. 6
Fig. 6
Adapted chemical structures for A - pyrrole, B - polypyrrole, C - porphyrin, and D - phthalocyanine (adapted from Sigma-Aldrich Co. LLC, St. Louis MO).
Fig. 7
Fig. 7
Increasingly large porphyrin rings have absorption maxima that shift into the NIR (411 – 953 nm). A – porphyrin, B – dodecaphyrin, C – octadecaphyrin (Ar = C6F5). Reproduced from Tanaka, et al.
Fig. 8
Fig. 8
In vivo fluorescent images of targeted QDs in mice. A – Targeted QDs preferentially accumulate in tumors. B – With a single excitation source, QDs tuned to different emission wavelengths can be detected simultaneously. Reproduced from Gao, et al.
Fig. 9
Fig. 9
TEM image of oleic acid-trioctylphosphine stabilized NaYF4:Yb3+,Er3+ upconverting nanophosphors. Reproduced from Budijono, et al. (2010).
Fig. 10
Fig. 10
Clockwise, from left to right, (adapted) examples of cyanine dyes ICG, Cy5, and IRDye 750 NHS Ester (adapted from LI-COR Biosciences Inc., Lincoln NE).
Fig. 11
Fig. 11
Examples of squaraines (adapted from Umezawa and Nakazumi).
Fig. 12
Fig. 12
Examples of BODIPY class dyes (adapted from Donuru and Umezawa).
Fig. 13
Fig. 13
Perylene and an example derivative (adapted from Quante, et al.)
Fig. 14
Fig. 14
Carbon nanotube (CNT) fluorescence emission after uptake into a macrophage-like cell (reproduced from Cherukuri, et al.)
Fig. 15
Fig. 15
Atomic force microscope (AFM) images of 30 nm micelles encapsulating hydrophobic ICG complex. Scale bar applies to both images. Reproduced from Rodriguez, et al.
Fig. 16
Fig. 16
Flash NanoPrecipitation schematic. Rapid mixing of the solvent and nonsolvent streams causes a drop in solvent quality and subsequent precipitation of the hydrophobic solutes. By matching the aggregation (tagg) and nucleation and growth (tng) time scales (which are both larger than the mixing time scale tmix), homogeneous nucleation kinetics result and polymer stabilized nanoparticles from 30 – 800 nm with narrow size distributions are produced. This scalable method allows for rapid, inexpensive, and versatile encapsulation of various hydrophobic molecules.,
Fig. 17
Fig. 17
SEM image of poly(lactic-co-glycolic acid)-b-poly(ethylene glycol) protected upconverting nanophosphors (140 nm) with additional 30 nm micelles visible. Reproduced from Budijono, et al.
Fig. 18
Fig. 18
Novel theranostic agent. A – schematic of nanoparticles containing a ~70 nm Au nanoshell with a silica shell doped with superparamagnetic iron oxide and ICG and surface-decorated with anti-HER2 antibodies for targeting. B – magnetic resonance imaging of the nanoparticles in vitro (no scale bar provided). C – photothermal ablation capabilities of the theranostic system demonstrated in vitro. D – fluorescence visualization of the nanoparticles after targeted uptake into OVCAR3 cells. Reproduced from Chen, et al.

References

    1. Bar-Shalom R, Yefremov N, Guralnik L, Gaitini D, Frenkel A, Kuten A, Altman H, Keidar Z, Israel O. Clinical Performance of PET/CT in Evaluation of Cancer: Additional Value for Diagnostic Imaging and Patient Management. Journal of Nuclear Medicine. 2003;44(8):1200–1209. - PubMed
    1. Beyer T, Townsend DW, Brun T, Kinahan PE, Charron M, Roddy R, Jerin J, Young J, Byars L, Nutt R. A Combined PET/CT Scanner for Clinical Oncology. Journal of Nuclear Medicine. 2000;41(8):1369–1379. - PubMed
    1. DeGrado TR, Turkington TG, Williams JJ, Stearns CW, Hoffman JM, Coleman RE. Performance Characteristics of a Whole-Body PET Scanner. Journal of Nuclear Medicine. 1994;35(8):1398–1406. - PubMed
    1. Strauss LG, Conti PS. The Applications of PET in Clinical Oncology. Journal of Nuclear Medicine. 1991;32(4):623–648. - PubMed
    1. Pichler BJ, Kolb A, Nagele T, Schlemmer HP. PET/MRI: Paving the Way for the Next Generation of Clinical Multimodality Imaging Applications. Journal of Nuclear Medicine. 2010;51(3):333–336. - PubMed

LinkOut - more resources