

Correlations among PPARγ, DNMT1, and DNMT3B Expression Levels and Pancreatic Cancer
- PMID: 22919364
- PMCID: PMC3423985
- DOI: 10.1155/2012/461784
Correlations among PPARγ, DNMT1, and DNMT3B Expression Levels and Pancreatic Cancer
Abstract
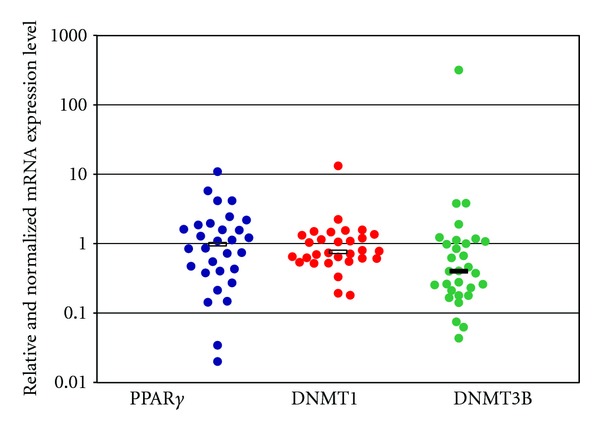
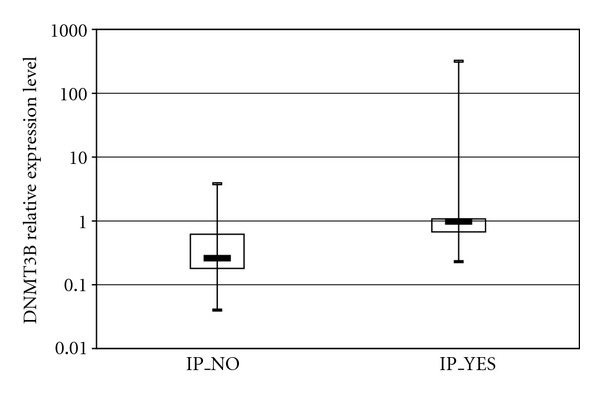
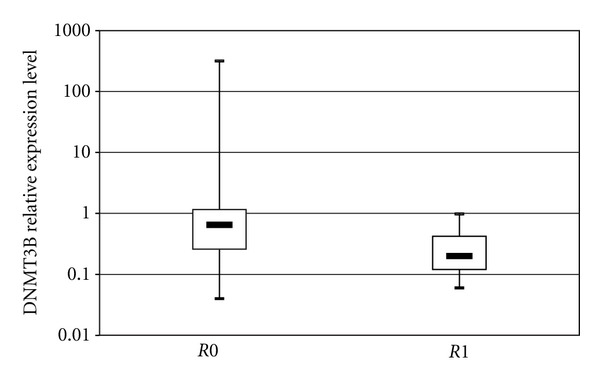
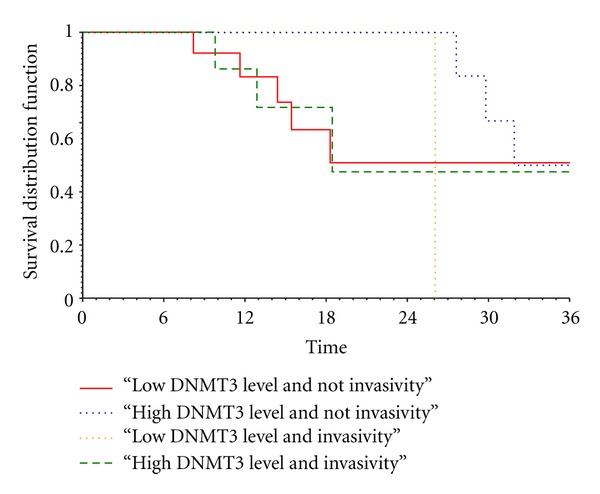
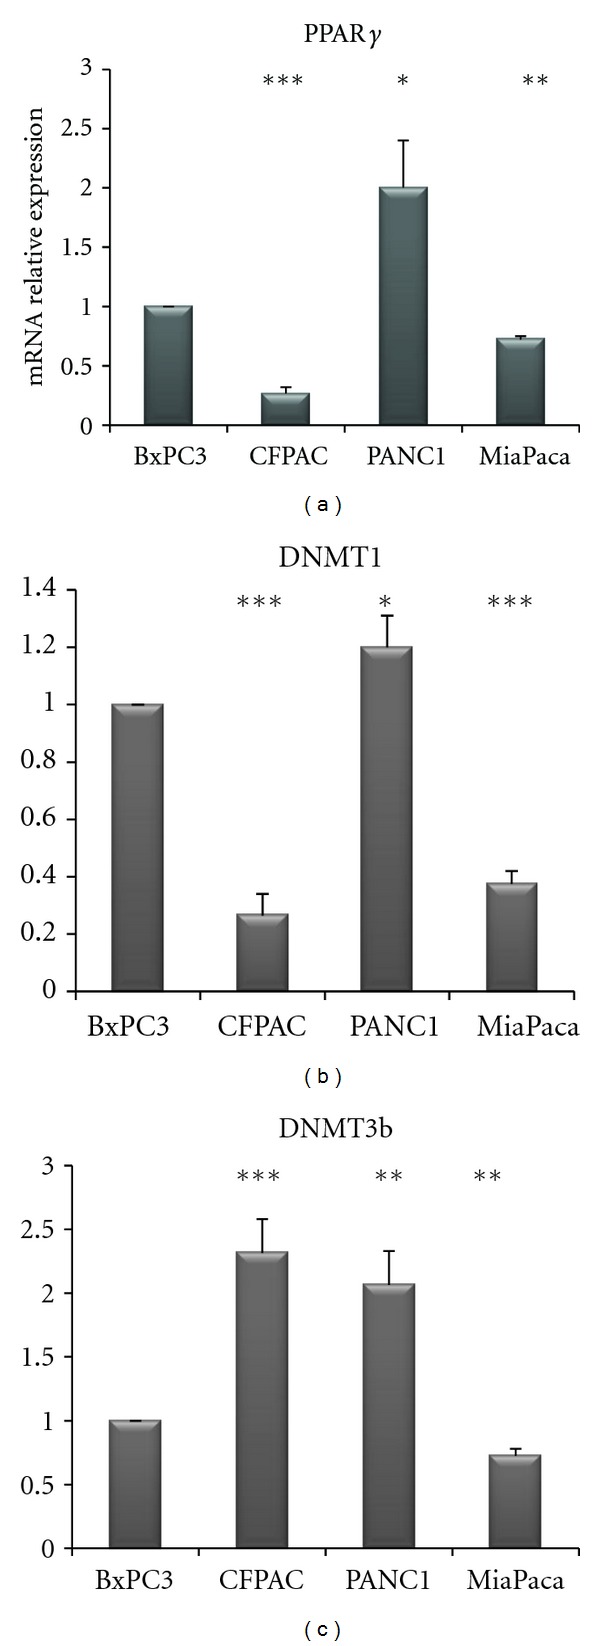
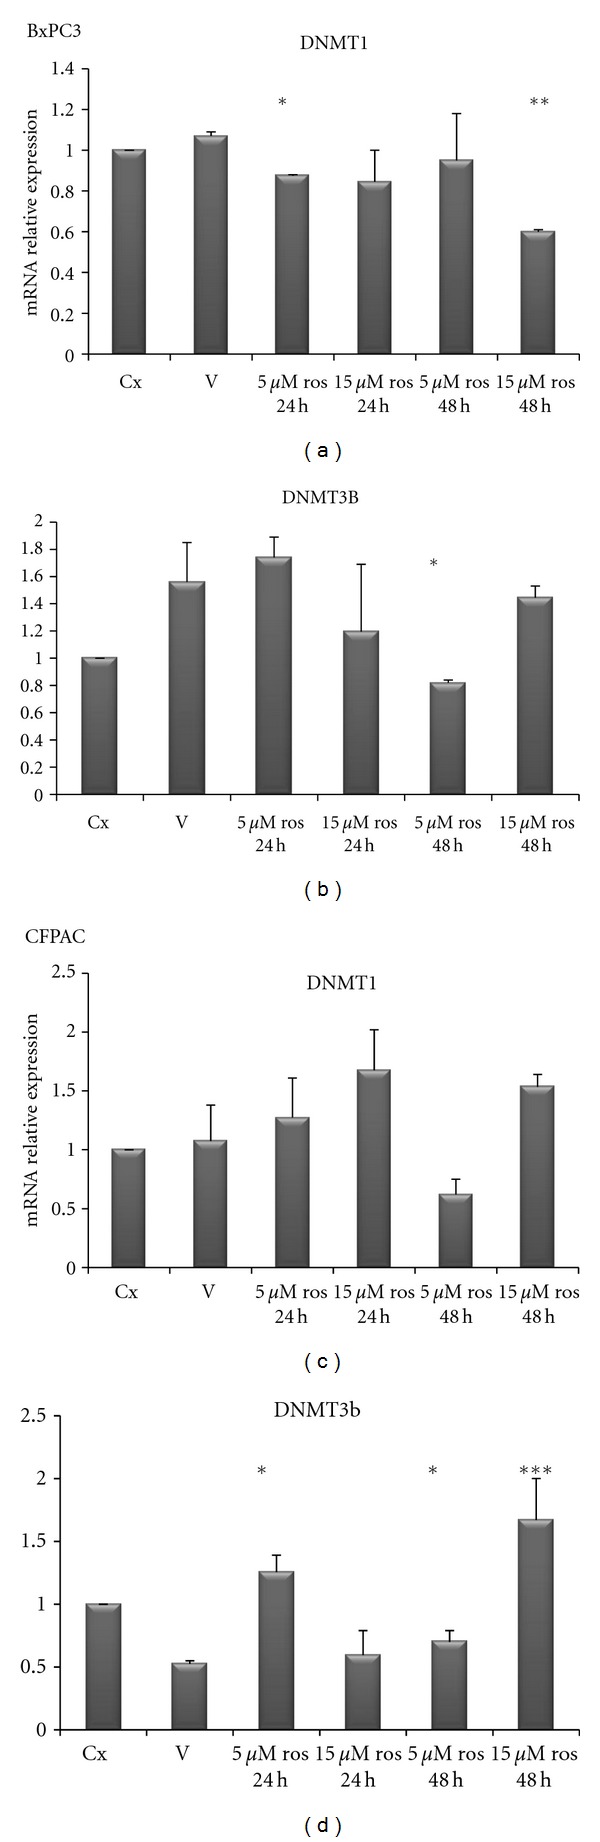
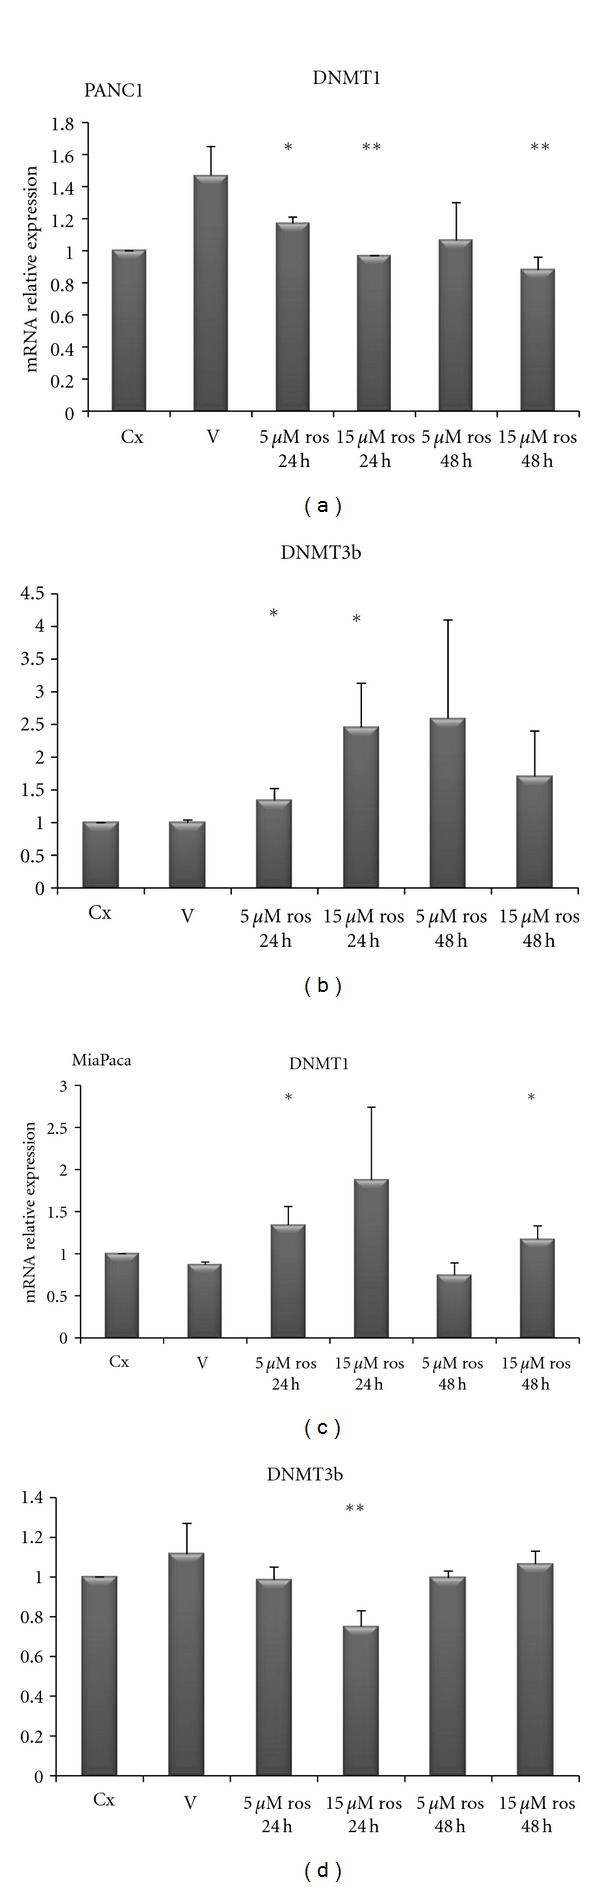
Emerging evidence indicates that peroxisome proliferator-activated receptor γ (PPARγ) and DNA methyltransferases (DNMTs) play a role in carcinogenesis. In this study we aimed to evaluate the expression of PPARγ, DNMT1, and DNMT3B and their correlation with clinical-pathological features in patients with pancreatic cancer (PC), and to define the effect of PPARγ activation on DNMTs expression in PC cell lines. qRT-PCR analysis showed that DNMT3B expression was downregulated in tumors compared to normal tissues (P = 0.03), whereas PPARγ and DNMT1 levels did not show significant alterations in PC patients. Expression levels between PPARγ and DNMT1 and between DNMT1 and DNMT3B were highly correlated (P = 0.008 and P = 0.05 resp.). DNMT3B overexpression in tumor tissue was positively correlated with both lymph nodes spreading (P = 0.046) and resection margin status (P = 0.04), and a borderline association with perineural invasion (P = 0.06) was found. Furthermore, high levels of DNMT3B expression were significantly associated with a lower mortality in the whole population (HR = 0.485; 95%CI = 0.262-0.895, P = 0.02) and in the subgroup of patients without perineural invasion (HR = 0.314; 95%CI = 0.130-0.758; P = 0.01), while such association was not observed in patients with tumor invasion into perineural structures (P = 0.70). In conclusion, in vitro and in vivo PPARγ and DNMTs appear interrelated in PC, and this interaction might influence cell phenotype and disease behavior.
Figures
Similar articles
-
Time-Qualified Patterns of Variation of PPARγ, DNMT1, and DNMT3B Expression in Pancreatic Cancer Cell Lines.PPAR Res. 2012;2012:890875. doi: 10.1155/2012/890875. Epub 2012 Aug 26. PPAR Res. 2012. PMID: 22966223 Free PMC article.
-
Investigation of the expression patterns and correlation of DNA methyltransferases and class I histone deacetylases in ovarian cancer tissues.Oncol Lett. 2013 Feb;5(2):452-458. doi: 10.3892/ol.2012.1057. Epub 2012 Dec 3. Oncol Lett. 2013. PMID: 23420051 Free PMC article.
-
Clinicopathological significance and prognostic value of DNA methyltransferase 1, 3a, and 3b expressions in sporadic epithelial ovarian cancer.PLoS One. 2012;7(6):e40024. doi: 10.1371/journal.pone.0040024. Epub 2012 Jun 29. PLoS One. 2012. PMID: 22768205 Free PMC article.
-
Expression Profiles of DNA Methylation and Demethylation Machinery Components in Pediatric Myelodysplastic Syndrome: Clinical Implications.Cancer Manag Res. 2020 Jan 23;12:543-556. doi: 10.2147/CMAR.S219026. eCollection 2020. Cancer Manag Res. 2020. PMID: 32158259 Free PMC article.
-
Oncogenic Roles and Inhibitors of DNMT1, DNMT3A, and DNMT3B in Acute Myeloid Leukaemia.Biomark Insights. 2019 May 8;14:1177271919846454. doi: 10.1177/1177271919846454. eCollection 2019. Biomark Insights. 2019. PMID: 31105426 Free PMC article. Review.
Cited by
-
Prognostic Model Construction of Disulfidptosis-Related Genes and Targeted Anticancer Drug Research in Pancreatic Cancer.Mol Biotechnol. 2025 Apr;67(4):1463-1482. doi: 10.1007/s12033-024-01131-8. Epub 2024 Apr 4. Mol Biotechnol. 2025. PMID: 38575817
-
Exosome and lipid metabolism-related genes in pancreatic adenocarcinoma: a prognosis analysis.Aging (Albany NY). 2023 Oct 18;15(20):11331-11368. doi: 10.18632/aging.205130. Epub 2023 Oct 18. Aging (Albany NY). 2023. PMID: 37857015 Free PMC article.
-
Modeling interactions between Human Equilibrative Nucleoside Transporter-1 and other factors involved in the response to gemcitabine treatment to predict clinical outcomes in pancreatic ductal adenocarcinoma patients.J Transl Med. 2014 Sep 10;12:248. doi: 10.1186/s12967-014-0248-4. J Transl Med. 2014. PMID: 25199538 Free PMC article.
-
Inhibition of Prostaglandin Reductase 2, a Putative Oncogene Overexpressed in Human Pancreatic Adenocarcinoma, Induces Oxidative Stress-Mediated Cell Death Involving xCT and CTH Gene Expressions through 15-Keto-PGE2.PLoS One. 2016 Jan 28;11(1):e0147390. doi: 10.1371/journal.pone.0147390. eCollection 2016. PLoS One. 2016. PMID: 26820738 Free PMC article.
-
Pancreatic Cancer, A Mis-interpreter of the Epigenetic Language.Yale J Biol Med. 2016 Dec 23;89(4):575-590. eCollection 2016 Dec. Yale J Biol Med. 2016. PMID: 28018146 Free PMC article. Review.
References
-
- Jemal A, Siegel R, Ward E, Hao Y, Xu J, Thun MJ. Cancer statistics, 2009. CA: Cancer Journal for Clinicians. 2009;59(4):225–249. - PubMed
-
- Landis SH, Murray T, Bolden S, Wingo PA. Cancer Statistics, 1999. CA: Cancer Journal for Clinicians. 1999;49(1):8–31. - PubMed
-
- Warshaw AL, Fernández-del Castillo C. Pancreatic carcinoma. The New England Journal of Medicine. 1992;326(7):455–465. - PubMed
-
- Ferré P. The biology of peroxisome proliferator-activated receptors: relationship with lipid metabolism and insulin sensitivity. Diabetes. 2004;53(supplement 1):S43–S50. - PubMed
LinkOut - more resources
Full Text Sources
