Comparative Study
. 2012 May 30:2:74.
doi: 10.3389/fcimb.2012.00074. eCollection 2012.

Development of a murine nose-only inhalation model of influenza: comparison of disease caused by instilled and inhaled A/PR/8/34

Affiliations
Comparative Study

Development of a murine nose-only inhalation model of influenza: comparison of disease caused by instilled and inhaled A/PR/8/34

Larry E Bowen et al. Front Cell Infect Microbiol. .

Abstract

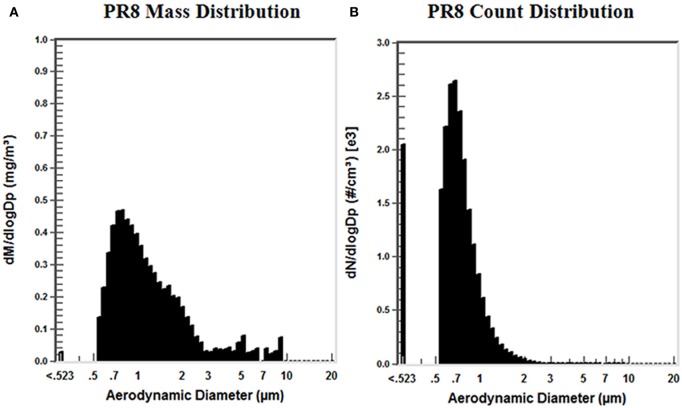
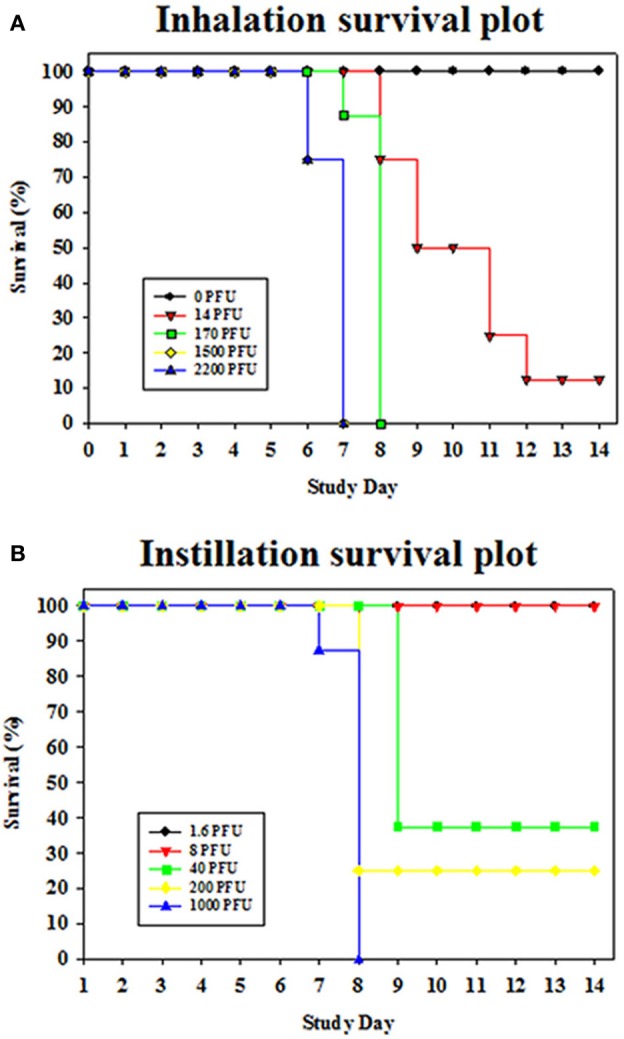
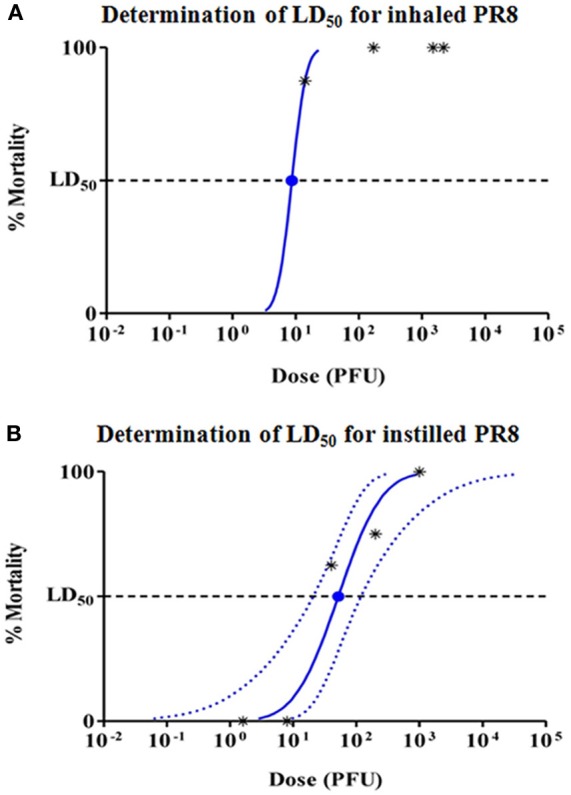
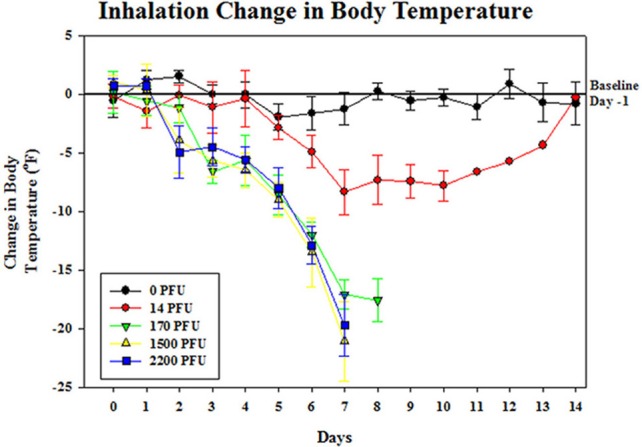
Influenza continues to cause widespread disease and death during winter months. In preclinical studies to evaluate the potential efficacy of drugs and vaccines, influenza challenge virus is usually instilled into the noses of animals in the form of large liquid drops. Since inhalation of aerosolized influenza is commonly associated with human transmission, instillation of challenge virus raises uncertainty about the applicability of results. In order to compare the challenge methods, we established conditions to generate influenza aerosols with a mass median aerodynamic diameter (MMAD) of 1 μm that were delivered to mice in a nose-only inhalation system. In this report, we describe the system and compare the 50% lethal dose (LD(50)) of instilled and inhaled A/PR/8/34 (PR8) in BALB/c mice. The estimated LD(50) for inhaled virus was 8.7 plaque forming units (PFU) and the mean time to death was 7.7 days, whereas the estimated LD(50) for instilled virus was 51.6 PFU and the mean time to death was 8.2 days. Our results show that mice are more sensitive to inhaled virus than virus delivered by intranasal instillation. The murine nose-only inhalation model of influenza infection can be used to infect large numbers of animals simultaneously with well-characterized, homogenous PR8 bioaerosol in a controlled and reproducible manner. This model provides the means to evaluate the efficacy of drug and vaccine candidates against the relevant route of challenge, thereby providing data that may better predict clinical outcome.

Keywords: aerosol; influenza; inhalation; instillation; mouse.


Figures

Figure 1
Figure 1
Distribution of particle size mass and count in PR8 aerosols. APS samples collected from the challenge plenum were used to determine, (A) the distribution of particle size mass; dM is the mass of the particles collected in the range (total mass) and dlogDp is the difference in the log of the channel width; and (B) the distribution of particle size count; dN is the number of the particles collected in the range (total concentration), and dlogDp is the difference in the log of the channel width.
Figure 2
Figure 2
(A) Inhalation and (B) instillation survival plots for mice exposed to PR8. A key indicating color code for each dose group is provided on the figure.
Figure 3
Figure 3
Probit analysis to determine LD50 for (A) inhaled, and (B) instilled PR8. Dashed lines show 95% confidence interval for the analysis. Since >50% of mice died in the lowest aerosol challenge group, 95% confidence intervals are not shown for inhaled PR8.
Figure 4
Figure 4
Change in body weight for groups of mice challenged with PR8 by (A) inhalation, and (B) instillation. Mice in each group (n = 8) were weighed individually on each day after challenge. Each graph shows the group mean change in weight relative to the Day 0 (inhalation) and Day 1 (instillation) baseline body weights. Error bars are ± standard deviation of the mean.
Figure 5
Figure 5
Change in body temperature for groups of mice challenged with PR8 aerosol. Temperatures of mice in each group (n = 8) were recorded individually on each day after challenge. The graph shows group mean change in temperature relative to the baseline temperature collected prior to challenge on Day 0 Error bars are ± standard deviation of the mean.

References

    1. Alford R. H., Kasel J. A., Gerone P. J., Knight V. (1966). Human influenza resulting from aerosol inhalation. Proc. Soc. Exp. Biol. Med. 122, 800–804 - PubMed
    1. Bakker-Woudenberg I. A. (2003). Experimental models of pulmonary infection. J. Microbiol. Methods 54, 295–313 10.1016/S0167-7012(03)00118-0 - DOI - PubMed
    1. Basu A., Shelke V., Chadha M., Kadam D., Sangle S., Gangodkar S., Mishra A. (2011). Direct imaging of pH1N1 2009 influenza virus replication in alveolar pneumocytes in fatal cases by transmission electron microscopy. J. Electron Microsc. (Tokyo) 60, 89–93 10.1093/jmicro/dfq081 - DOI - PMC - PubMed
    1. Blachere F., Lindsley W., Pearce T., Anderson S., Fisher M., Khakoo R., Meade B., Lander O., Davis S., Thewlis R., Celik I., Chen B., Beezhold D. (2009). Measurement of airborne influenza virus in a hospital emergency department. Clin. Infect. Dis. 48, 438–440 10.1086/596478 - DOI - PubMed
    1. Brankston G., Gitterman L., Hirji Z., Lemieux C., Gardam M. (2007). Transmission of influenza A in human beings. Lancet Infect. Dis. 7, 257–265 10.1016/S1473-3099(07)70029-4 - DOI - PubMed

Publication types