. 2012 Aug 23;75(4):601-17.
doi: 10.1016/j.neuron.2012.05.034.

Human-specific transcriptional networks in the brain

Affiliations

Human-specific transcriptional networks in the brain

Genevieve Konopka et al. Neuron. .

Abstract

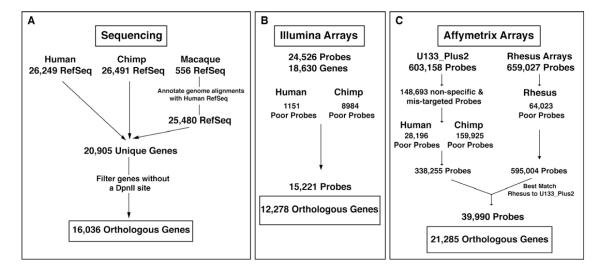
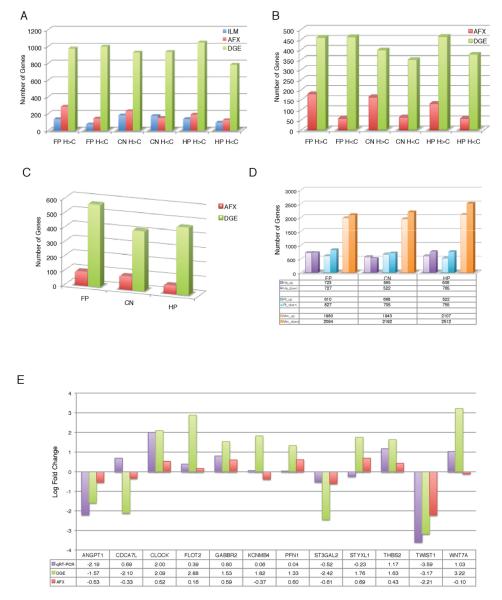
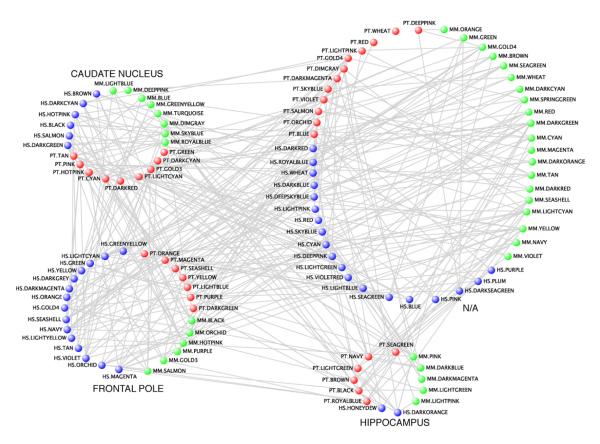
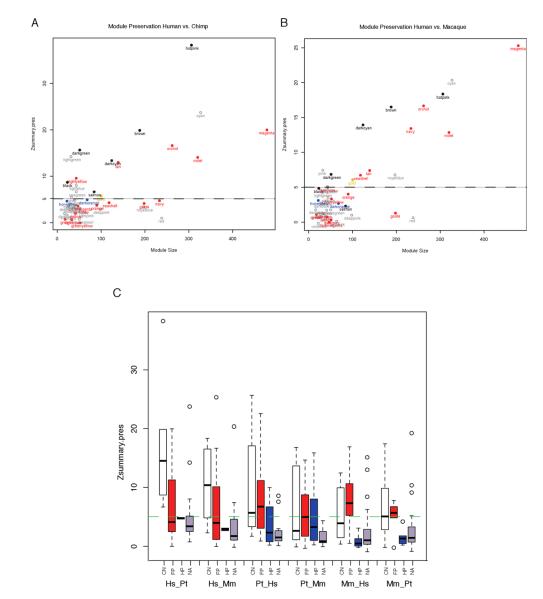
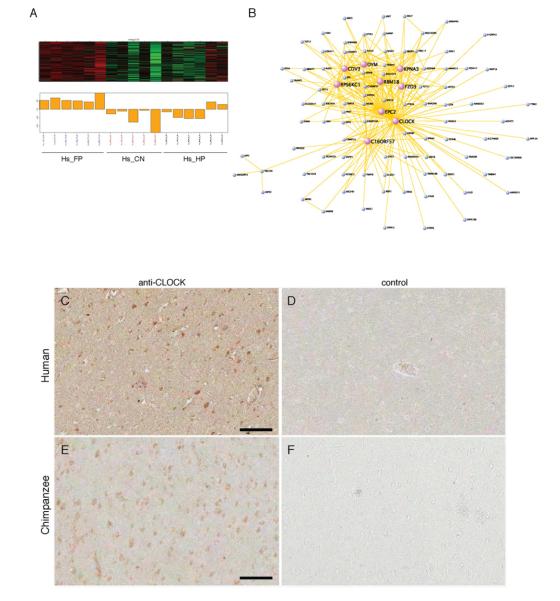
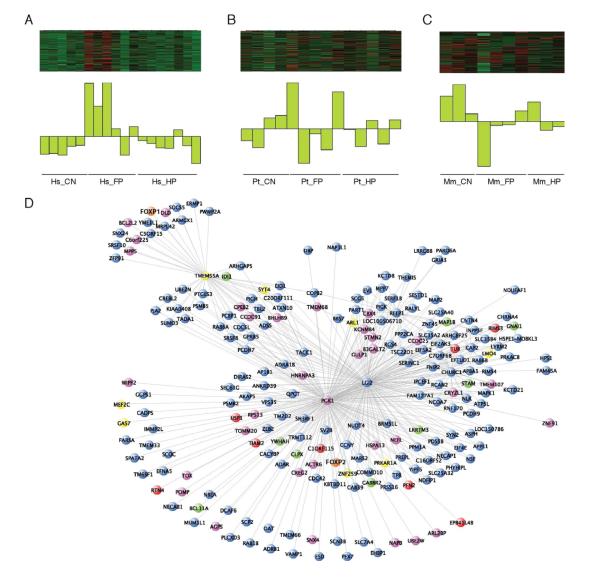
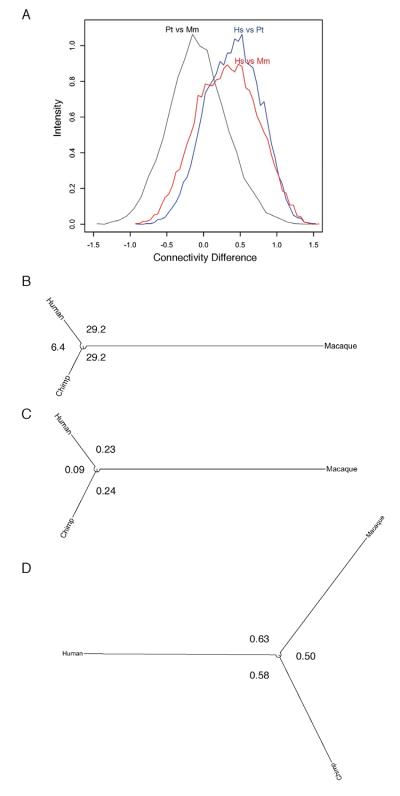
Understanding human-specific patterns of brain gene expression and regulation can provide key insights into human brain evolution and speciation. Here, we use next-generation sequencing, and Illumina and Affymetrix microarray platforms, to compare the transcriptome of human, chimpanzee, and macaque telencephalon. Our analysis reveals a predominance of genes differentially expressed within human frontal lobe and a striking increase in transcriptional complexity specific to the human lineage in the frontal lobe. In contrast, caudate nucleus gene expression is highly conserved. We also identify gene coexpression signatures related to either neuronal processes or neuropsychiatric diseases, including a human-specific module with CLOCK as its hub gene and another module enriched for neuronal morphological processes and genes coexpressed with FOXP2, a gene important for language evolution. These data demonstrate that transcriptional networks have undergone evolutionary remodeling even within a given brain region, providing a window through which to view the foundation of uniquely human cognitive capacities.


Figures

Figure 1
Figure 1. Schematic of experimental design
Filtering strategy for (A) DGE samples, (B) Illumina microarrays, and (C) Affymetrix microarrays. See also Table S1.
Figure 2
Figure 2. Identification of genes specifically expressed in human brain
(A) Graph of number of differentially expressed genes using pairwise comparisons between humans and chimps without outgroup inclusion in each brain region (upregulated genes= H>C; downregulated genes=H 2). (B) Graph of number of differentially expressed genes between humans and chimps with the inclusion of macaque outgroup data in each brain region (Bayesian t-test, FDR <0.05, absolute fold change > 2). (C) Graph of number of genes from (B) that are uniquely differentially expressed in only one brain region. (D) Graph of number of genes that are changing along a specific lineage in each brain region (ANOVA; FDR < 0.05). (E) qRT-PCR analyses of identified hDE genes in FP using DGE. See also Figures S1 and S2.
Figure 3
Figure 3. Connectivity among module eigengenes
Visualization of the module eigengene overlaps. Nodes for human modules are blue, nodes for chimpanzee modules are red, and nodes for macaque modules are green. See also Table S2.
Figure 4
Figure 4. Module preservation among primate brain regions
Graph of the module preservation score (Zsummary.pres) compared to the number of genes in a module (module size) for the human network as reference compared to (A) chimpanzee and (B) macaque. CN modules are in black, FP in red, HP in blue, and modules not correlated to region in grey. Modules below the dashed line at 5 in both comparisons are human-specific whereas those at or above 5 are conserved. (C) Distribution of preservation scores using each species for the reference network. CN networks are conserved in all cases whereas FP networks are only specific when human is used as the reference genome. See also Figure S3 and Table S3.
Figure 5
Figure 5. Visualization of a human-specific gene co-expression network: the Hs_orange module
(A-B) Visualization of the top 300 connections among the co-expressed genes in the module. Hub genes are denoted using purple circles. (C-F) Immunohistochemistry for CLOCK in human FP (C) and chimpanzee FP (E). Corresponding negative control sections are shown in (D) and (F). Scalebars are 100 microns.
Figure 6
Figure 6. Visualization of a human-specific gene co-expression network: the olivedrab2 module
Visualization of the module eigengene in the olivedrab2 module in the (A) human samples and the expression of the same genes in the (B) chimpanzee and (C) macaque samples. (D) Visualization of the top 500 connections among the co-expressed genes in the module. FOXP2 and FOXP1 are highlighted in orange. Genes in purple are specifically expressed along the human lineage in FP, genes in red are FOXP2 targets identified in human neural progenitors, genes in yellow are FOXP2 targets identified in human fetal brain (Spiteri et al., 2007), human transformed neuronal cell lines (Konopka et al., 2009), or mouse brain (Vernes et al., 2011) and genes in green are both human-specific and FOXP2 targets. See also Figure S4 and Table S4.
Figure 7
Figure 7. Brain network connectivity differences among primates
The human olivedrab2 FP module as an example of differential connectivity in the primate brain. (A) Histogram of the difference in connectivity among genes in the olivedrab2 module between each species. Human networks compared to chimpanzee (blue) and macaque (red) networks have greater differences than between chimpanzee and macaque (grey). Unrooted distance trees demonstrate that while human and chimpanzee are more similar as (B) species overall and (C) absolute gene expression, while the (D) connectivity of genes in the human FP is greater.

Comment in

References

    1. Akamatsu W, Okano HJ, Osumi N, Inoue T, Nakamura S, Sakakibara S, Miura M, Matsuo N, Darnell RB, Okano H. Mammalian ELAV-like neuronal RNA-binding proteins HuB and HuC promote neuronal development in both the central and the peripheral nervous systems. Proc Natl Acad Sci U S A. 1999;96:9885–9890. - PMC - PubMed
    1. Allman JM, Tetreault NA, Hakeem AY, Manaye KF, Semendeferi K., Erwin, J., Park S, Goubert V, Hof PR. The von Economo neurons in frontoinsular and anterior cingulate cortex in great apes and humans. Brain Struct Funct. 2010;214:495–517. - PubMed
    1. Asmann YW, Klee EW, Thompson EA, Perez EA, Middha S, Oberg AL, Therneau TM, Smith DI, Poland GA, Wieben ED, Kocher JP. 3′ tag digital gene expression profiling of human brain and universal reference RNA using Illumina Genome Analyzer. BMC Genomics. 2009;10:531. - PMC - PubMed
    1. Babbitt CC, Fedrigo O, Pfefferle AD, Boyle AP, Horvath JE, Furey TS, Wray GA. Both noncoding and protein-coding RNAs contribute to gene expression evolution in the primate brain. Genome Biol Evol. 2010;2:67–79. - PMC - PubMed
    1. Bernard A, Lubbers LS, Tanis KQ, Luo R, Podtelezhnikov AA, Finney EM, McWhorter MME, Serikawa K, Lemon T, Morgan R, et al. Transcriptional architecture of the primate neocortex. Neuron. 2012;73:1083–1099. - PMC - PubMed

Publication types

Associated data