

Deregulation of miR-100, miR-99a and miR-199b in tissues and plasma coexists with increased expression of mTOR kinase in endometrioid endometrial carcinoma
- PMID: 22920721
- PMCID: PMC3495850
- DOI: 10.1186/1471-2407-12-369
Deregulation of miR-100, miR-99a and miR-199b in tissues and plasma coexists with increased expression of mTOR kinase in endometrioid endometrial carcinoma
Abstract
Background: Alterations of mTOR gene expression have been implicated in the pathogenesis of endometrioid endometrial cancer however only few studies explored the cause of increased mTOR activation in this malignancy. miRNAs are small, noncoding RNAs, which were proven to regulated gene expression at the posttranscriptional level. The study aimed to explore deregulation of miRNAs targeting mTOR kinase (miR-99a, miR-100 and miR-199b) as a possible cause of its altered expression in EEC tissues. In addition expression of the three miRNAs was investigated in plasma of EEC patients and was assessed in terms of diagnostic and prognostic utility.
Methods: We investigated expression of mTOR kinase transcripts in 46 fresh tissue samples. Expression of miR-99a, miR-100 and miR-199b was investigated in the same group of fresh samples, and in additional 58 FFPE sections as well as in 48 plasma samples using qPCR. Relative quantification was performed using experimentally validated endogenous controls.
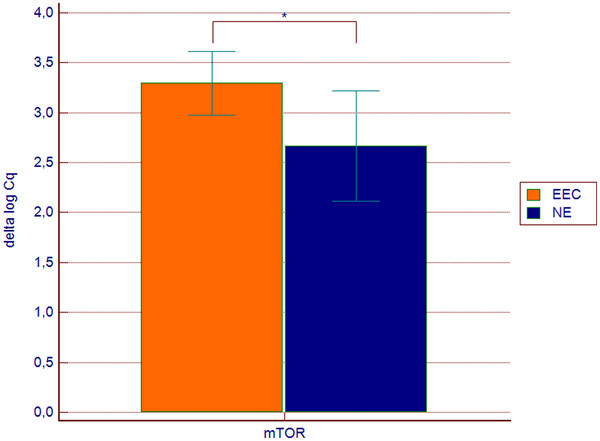
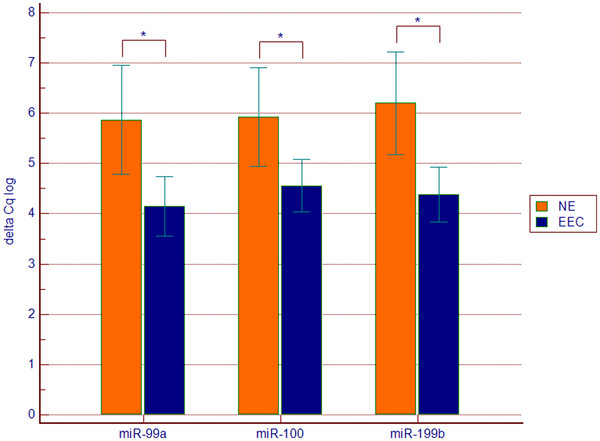
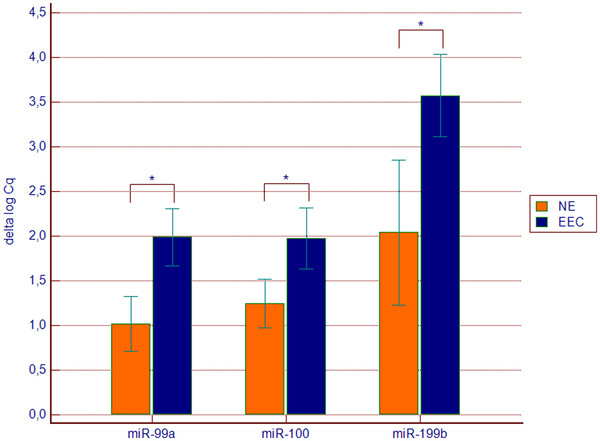
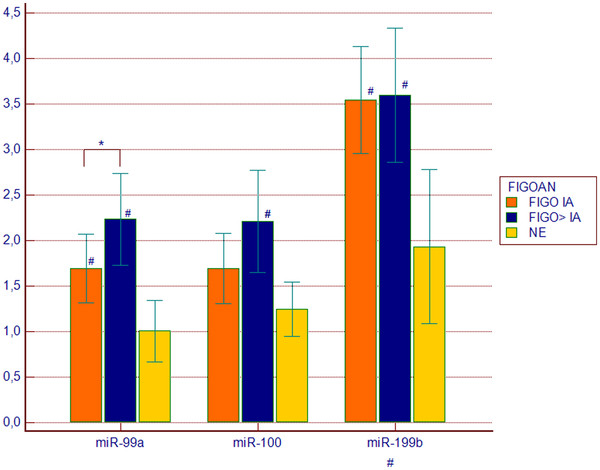
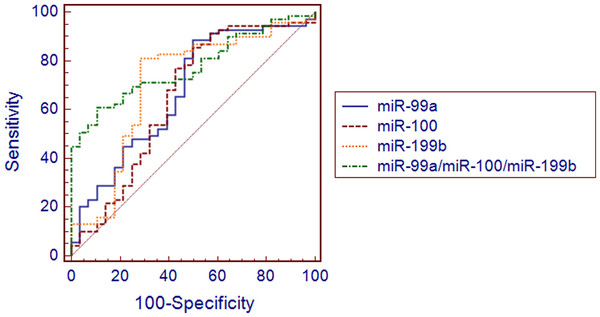
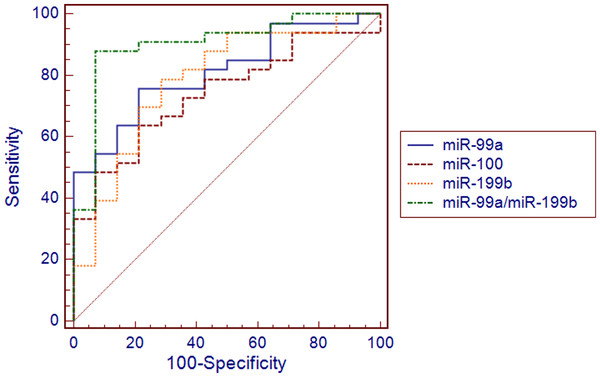
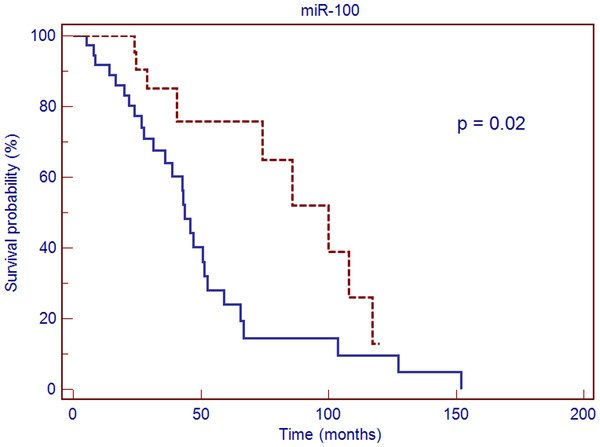
Results: mTOR kinase expression was increased in EEC tissues and was accompanied by decreased expression of all three miRNAs. Down-regulation of the investigated miRNAs was discovered in plasma of EEC patients and miRNA signatures classified EEC tissues (miR-99a/miR-100/miR-199b) and plasma (miR-99a/miR-199b) samples with higher accuracy in comparison to single miRNAs. We also revealed that miR-100 was an independent prognostic marker of overall survival.
Conclusions: We conclude that increased expression of mTOR kinase coexists with down-regulation of its targeting miRNAs, which could suggest a new mechanism of mTOR pathway alterations in EEC. In addition, our findings implicate that miRNA signatures can be considered promising biomarkers for early detection and prognosis of endometrioid endometrial carcinoma.
Figures
References
-
- Ferlay J, Parkin DM, Steliarova-Foucher E. Estimates of cancer incidence and mortality in Europe in 2008. Eur J Cancer. 2010;6:765–781. - PubMed
-
- [Polish Cancer Registry] Krajowy Rejestr Nowotworów. http://epid.coi.waw.pl/krn/
-
- Bansal N, Yendluri V, Wenham RM. The molecular biology of endometrial cancers and the implications for pathogenesis, classification, and targeted therapies. Cancer Control. 2009;16:8–13. - PubMed
Publication types
MeSH terms
Substances
LinkOut - more resources
Full Text Sources
Molecular Biology Databases
Research Materials
Miscellaneous
